


Systemic inflammatory diseases could act as an unfavorable condition in which epicardial adipose tissue (EAT) becomes harmful to cardiovascular health. The objectives were: (a) to quantitatively compare the presence of EAT between patients with systemic inflammatory diseases and controls; (b) to analyze the association between EAT and subclinical atheromatosis in individuals with systemic inflammatory diseases.
MethodsStudies that have quantified EAT in a population with systemic inflammatory diseases compared to a control group, or that describe the association between EAT and the presence of subclinical atheromatosis in patients with systemic inflammatory diseases were included. A quantitative analysis was performed for the first objective. This systematic review was performed according to PRISMA guidelines.
ResultsTwenty-one studies including 1448 patients with systemic inflammatory diseases, were considered eligible for this study. Patients with systemic inflammatory disease have a higher volume (MD: 10.4cm3 [1.8–19.1]; p<0.01), higher thickness (MD: 1.0mm [0.8–1.2]; p<0.01), and a statistically non-significant higher area (MD: 3.1cm2 [1.0–5.2]; p=0.46) of EAT compared to the control group. Most studies reported a significant association between EAT and subclinical atheromatosis in patients with different systemic inflammatory diseases.
ConclusionThis study demonstrated that EAT is increased in patients with systemic inflammatory diseases compared with healthy controls, and that EAT measurement is closely correlated with subclinical atherosclerosis in these patients. The causality of this association should be tested in prospective studies.
Las enfermedades inflamatorias sistémicas podrían aumentar el riesgo cardiovascular asociados a un aumento del tejido adiposo epicárdico (TAE). Los objetivos de este estudio, fueron: a) comparar cuantitativamente la presencia de TAE entre pacientes con enfermedades inflamatorias sistémicas y controles, y b) analizar la asociación entre TAE y atero“matosis subclínica en individuos con enfermedades inflamatorias sistémicas.
MétodosSe incluyeron estudios que hayan cuantificado la TAE en una población con enfermedades inflamatorias sistémicas frente a un grupo control, o que describan la asociación entre la TEA y la presencia de ateromatosis subclínica en pacientes con enfermedades inflamatorias sistémicas. Para el primer objetivo se realizó un análisis cuantitativo. Esta revisión sistemática se realizó de acuerdo con las guías PRISMA.
ResultadosVeintiún estudios que incluyeron 1.448 pacientes con enfermedades inflamatorias sistémicas se consideraron elegibles para este estudio. Los pacientes con enfermedad inflamatoria sistémica tienen mayor volumen (DM: 10,4cm3 [1,8-19,1]; p<0,01), mayor grosor (DM: 1,0mm [0,8-1,2]; p<0,01) y un área mayor estadísticamente no significativa (DM: 3,1cm2 [1,0-5,2]; p=0,46) de EAT en comparación con el grupo de control. La mayoría de los estudios informaron una asociación significativa entre EAT y ateromatosis subclínica en pacientes con diferentes enfermedades inflamatorias sistémicas.
ConclusiónEste estudio demostró que la TAE aumenta en pacientes con enfermedades inflamatorias sistémicas en comparación con controles sanos, y que la medición de EAT está estrechamente relacionada con la aterosclerosis subclínica en estos pacientes. La causalidad de esta asociación debe probarse en estudios prospectivos.
Systemic inflammatory diseases are associated with an increased risk of cardiovascular complications.1 The basis of cardiovascular risk is atherosclerosis, a complex disease that includes several pathogenic mechanisms such as genetic, metabolic, degenerative, and inflammatory issues.2 In addition, subclinical atheromatosis can be identified through various noninvasive diagnostic methods such as ultrasound or computed tomography.3
Epicardial adipose tissue (EAT) is defined as a fat depot localized between the myocardial surface and the visceral layer of the pericardium. It is a type of visceral fat.4 There is growing evidence about the importance of epicardial adiposity on cardiometabolic risk.5 Several studies have shown that EAT is highly related to the extent and severity of coronary artery disease and it is also associated with high-risk atherosclerotic plaque composition.6
Under physiological conditions, EAT is capable of releasing several anti-inflammatory and anti-atherogenic hormones, such as adiponectin.7 However, under pathological conditions, the protective properties can disappear and EAT becomes a deleterious tissue promoting the development of atherosclerosis and related cardiovascular complications. Therefore, it could happen that systemic inflammatory diseases act as an unfavorable condition in which the EAT becomes harmful to cardiovascular health.
The objectives of this systematic review were: (a) to quantitatively compare the presence of EAT between patients with systemic inflammatory diseases and a control group; (b) to analyze the association between EAT and the presence of subclinical atheromatosis in individuals with systemic inflammatory diseases.
Material and methodsThis systematic review was performed according to the Preferred Reporting Items for Systematic Reviews and Meta-Analyses (PRISMA) guidelines8 and was registered in PROSPERO.
Eligibility criteriaEligible studies were included following these inclusion criteria: (1) experimental or observational studies developed in humans; (2) studies that reported EAT values, both in the inflammatory disease group (rheumatoid arthritis [RA], systemic lupus erythematosus [SLE], psoriasis, inflammatory bowel disease [IBD], and ankylosing spondylitis [AS]) and in the control group; (3) studies that reported the association between EAT and the presence of subclinical atheromatosis in the inflammatory disease group. Studies that met inclusion criteria 1 and 2 or 1 and 3 were included. Expert opinions, reviews, or case series were excluded from this review.
Information sources and search strategyA literature search was performed to detect studies that have evaluated the presence of EAT in patients with systemic inflammatory diseases. Two reviewers searched the electronic PubMed/MEDLINE, Embase, Science Direct, Scopus, Google Scholar, and Cochrane Controlled Trials databases using “epicardial adipose tissue” or “epicardial fat” terms combined with the following terms: “rheumatoid arthritis”, “systemic lupus erythematosus”, “psoriasis”, “inflammatory bowel disease”, “ankylosing spondylitis”, “inflammatory diseases”, “autoimmune diseases” and “rheumatological diseases”. There were no idiomatic, geographical or publication restrictions. The last article search ended on 15 June 2022.
Selection process and data collection processOne investigator screened the title and abstract for initial inclusion. Full texts were reviewed independently by the two investigators for further screening. The authors also conducted a “snowball search” to find other articles. In addition, a manual search of the bibliography of included studies was performed to identify additional studies. Study characteristics were extracted, and the data were tabulated into tables developed by researchers. For any disagreements that occurred during the screening and data extraction stages between the two investigators, a third reviewer was consulted.
Effect measures and synthesis methodsOne of the objectives of this systematic review was to assess whether the presence of EAT is quantitatively more significant in patients with systemic inflammatory diseases compared to a control group. For EAT measurements, computed tomography (volume expressed in mL or cm3; or area expressed in cm2) or ultrasound (thickness expressed in millimeters [mm]) were assessed. A quantitative analysis was performed on the studies that reported this variable, both in the inflammatory disease group and in the control group (meta-analysis). Effect size measures were expressed as mean difference (MD), and the I2 statistic was calculated to quantify trial heterogeneity and inconsistency. When the summary/dispersion measures were not mean, and standard deviation, conversion tools previously suggested by the literature were used.9 Depending on the value of I2, a fixed effects model (I2<40%) or a random effects model (I2>40%) was chosen. Whether one or more assessed studies had a negative impact on heterogeneity was determined using an influence analysis based on the leave-one-out method. A Z test was used to compare mean effects between subgroups.
The second aim of this systematic review was to analyze the association between EAT and the presence of subclinical atheromatosis in individuals with systemic inflammatory diseases. The presence of subclinical atheromatosis was reported according to the different definitions in included studies, such as carotid intima–media thickness (CIMT), brachial artery flow-mediated dilatation, or aortic pulse wave velocity (aPWV) estimated by ultrasound. In addition, coronary artery calcification (CAC) or the presence of coronary plaques by computed tomography also was considered. In this case, meta-analysis was not possible due to heterogeneity of the populations included, the different EAT measurement, and the different methods to evaluate the presence of subclinical atheromatosis.
Statistical analyses were performed using the R software (“The R Foundation for Statistical Computing”, Vienna, Austria) for statistical computing version 3.5.1 with additional specific packages.9 A two-tailed p-value <0.05 was considered statistically significant.
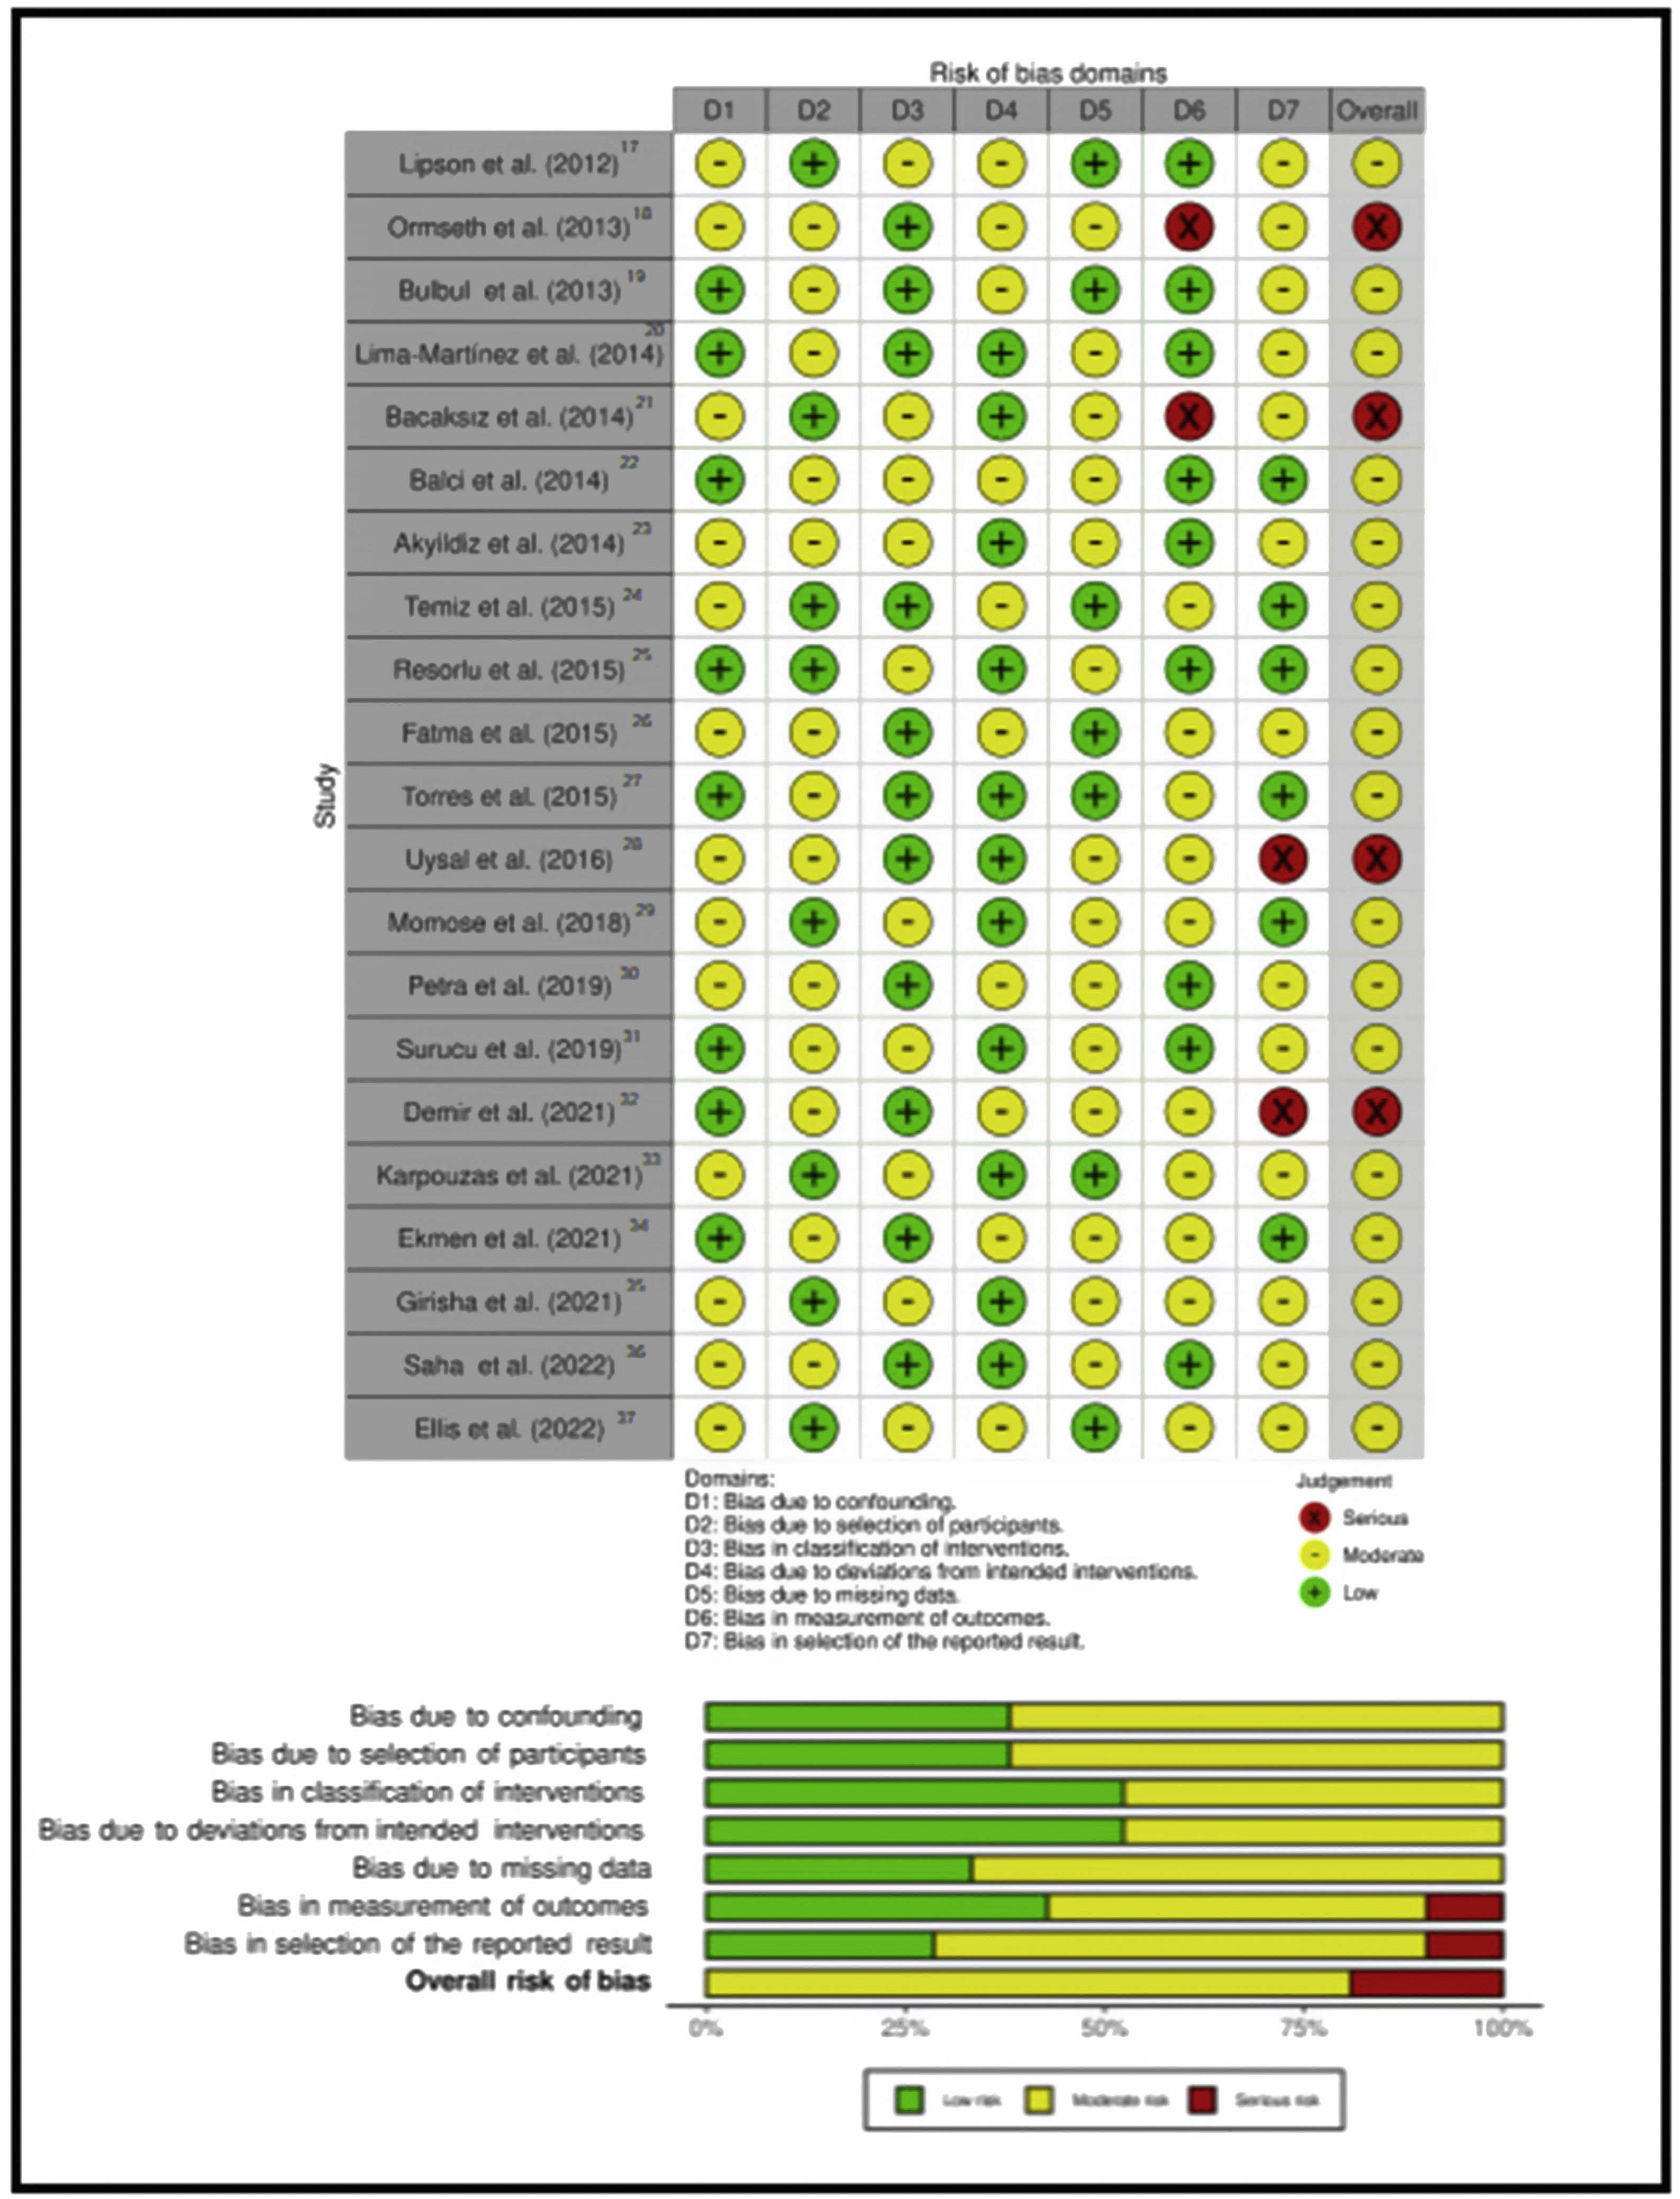
Study risk of bias assessmentThe risk of bias was assessed using the Cochrane Risk of Bias in Non-Randomised Studies of Interventions (ROBINS-1) tool. It evaluates 7 domains related to bias due to confounding, bias in selection of participants into the study, bias in classification of interventions, bias due to deviations from intended interventions, bias due to missing data, bias in measurement of outcomes and bias in selection of the reported result. The categories for risk of bias judgements are “Low risk”, “Moderate risk”, “Serious risk” and “Critical risk” of bias. The “No information” category should be used only when insufficient data are reported to permit a judgement. Any discrepancy between the two reviewers was resolved through discussion and by involving a third reviewer.
Analysis of publication biasModified Egger's regression intercept tests were done in the two analyzes that included at least 5 studies. A p-value less than 0.1 was considered significant for the linear regression test.
Sensitivity analysisA sensitivity analysis was performed. It consists of replicating the results of the meta-analysis, excluding in each step one of the studies included in the review.
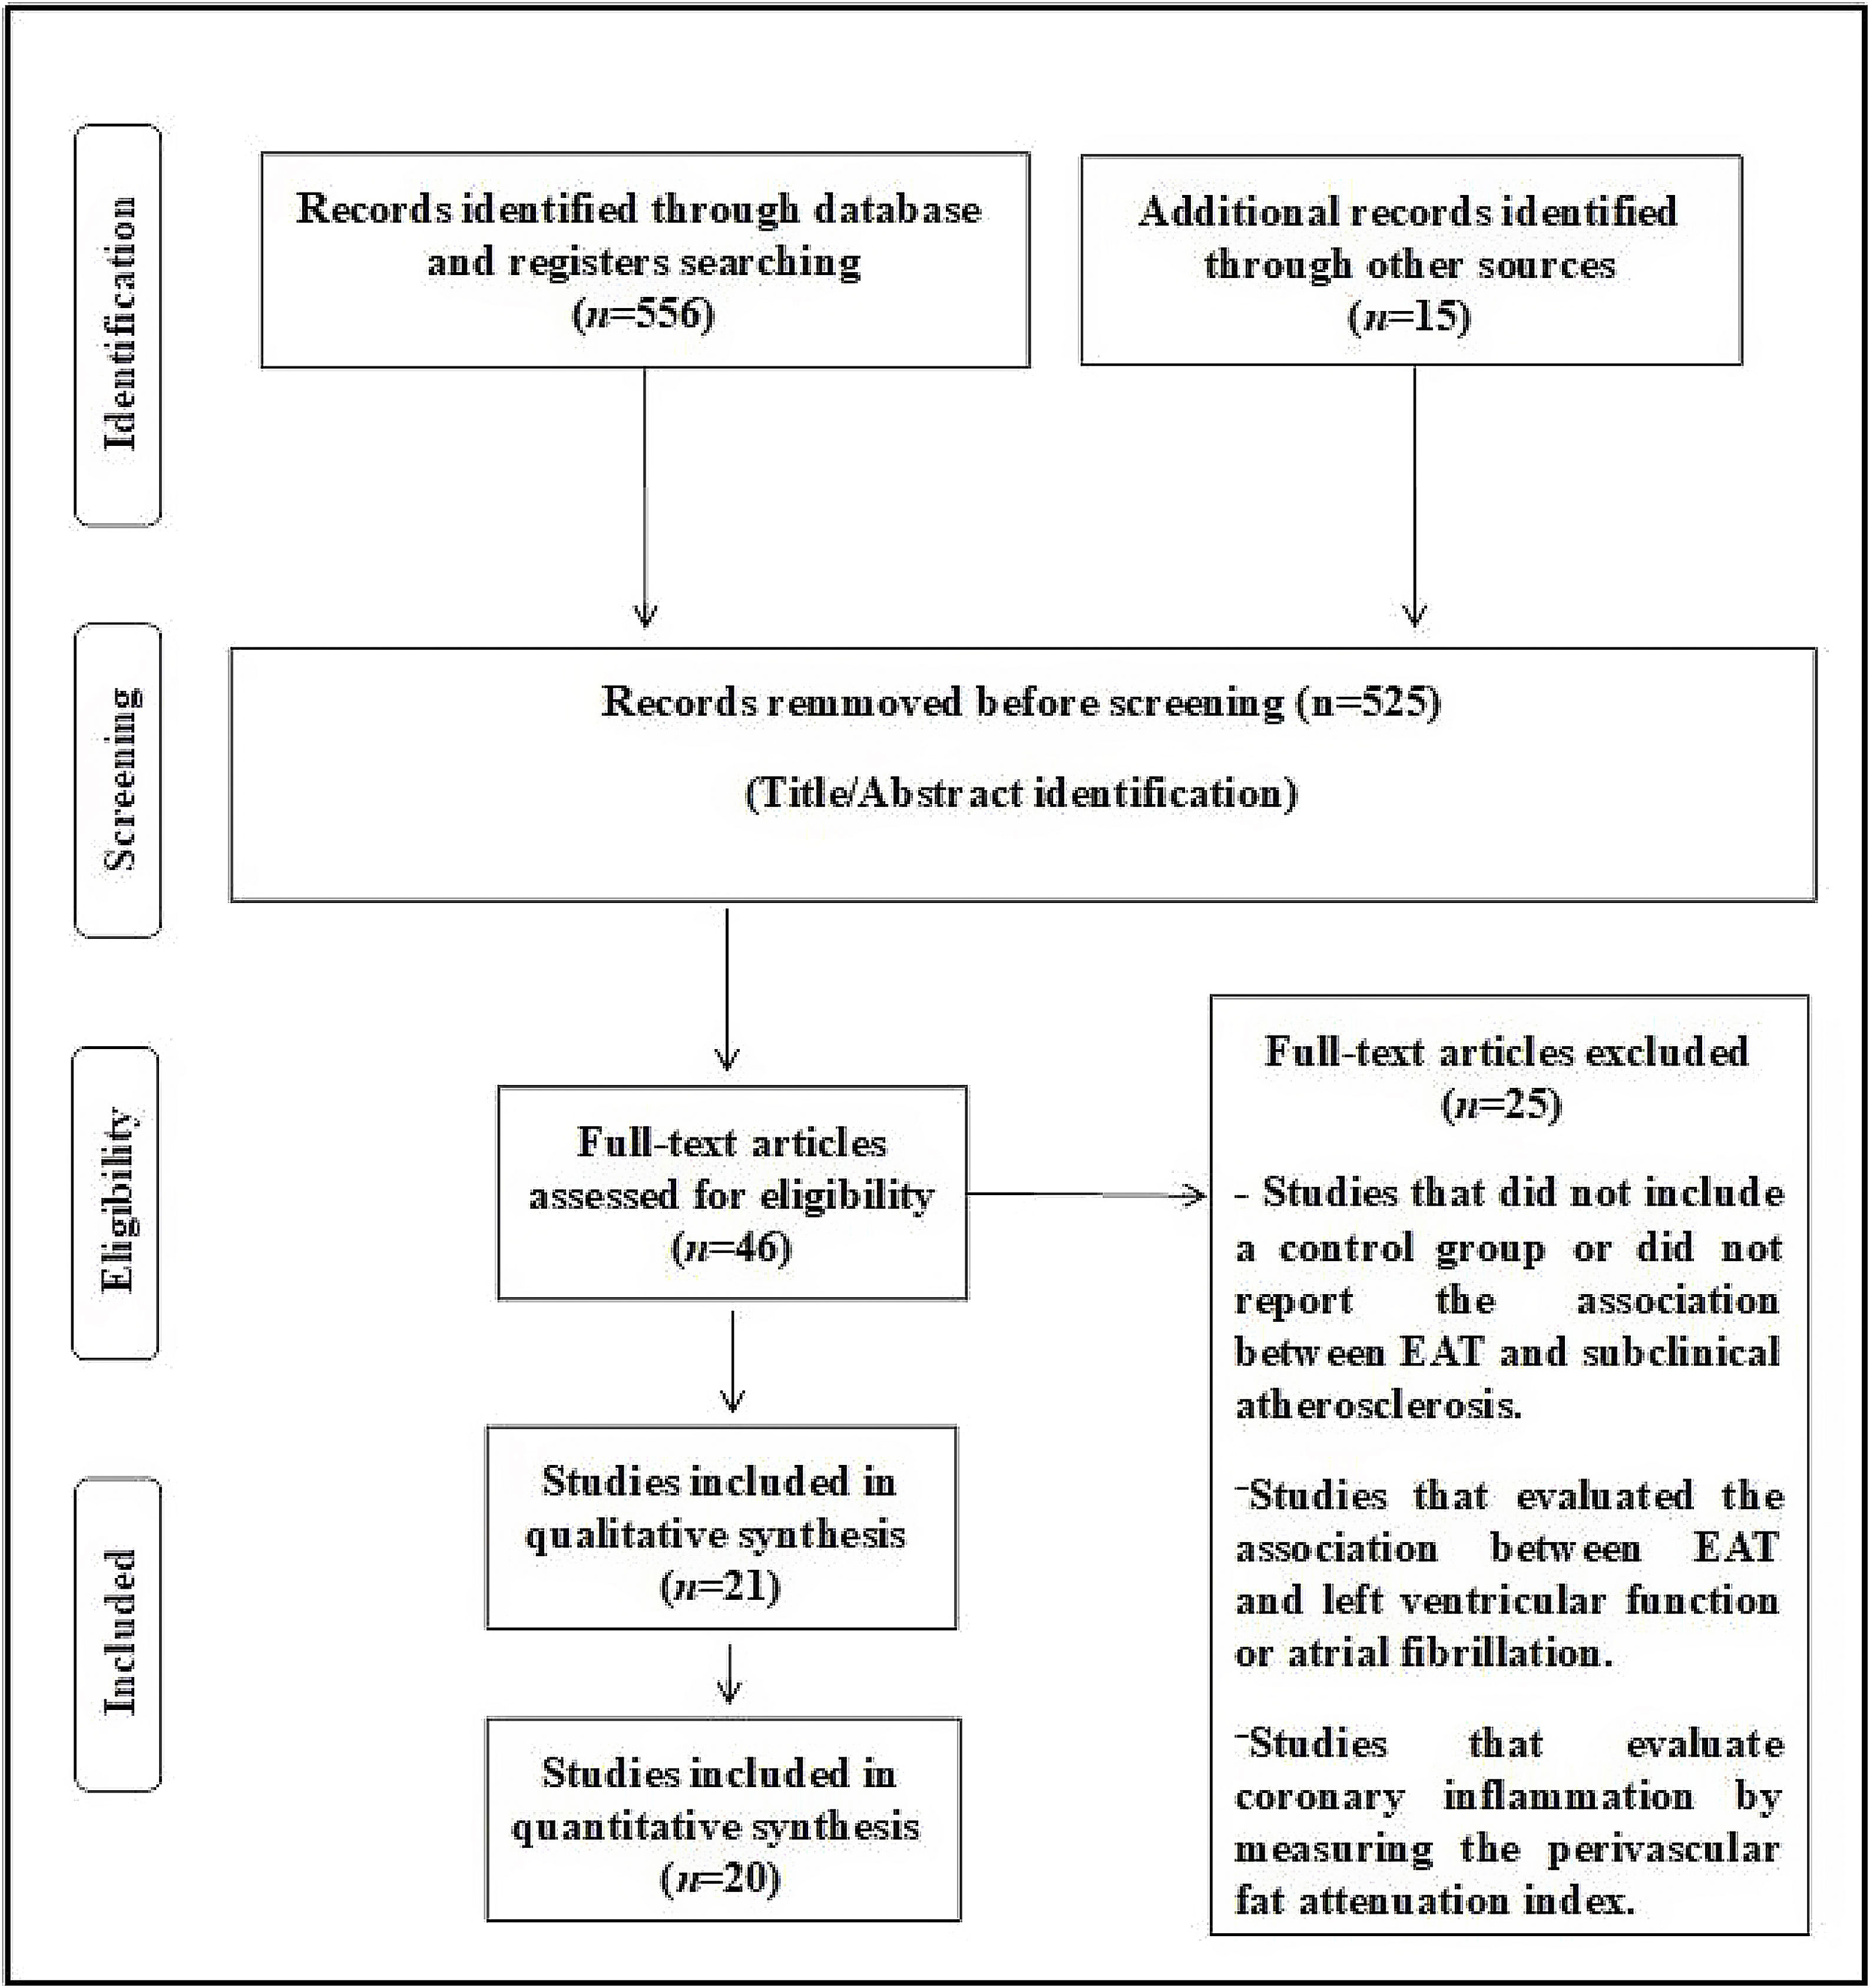
ResultsThe search included 556 potentially relevant articles after title screening, and 525 studies were excluded after title/abstract screening, as these were duplicate studies or did not assess the purpose of this study. After careful reading of the articles, 25 studies were removed because these studies did not report the exposure/event of interest. A flow diagram of the study's screening process is shown in Fig. 1.

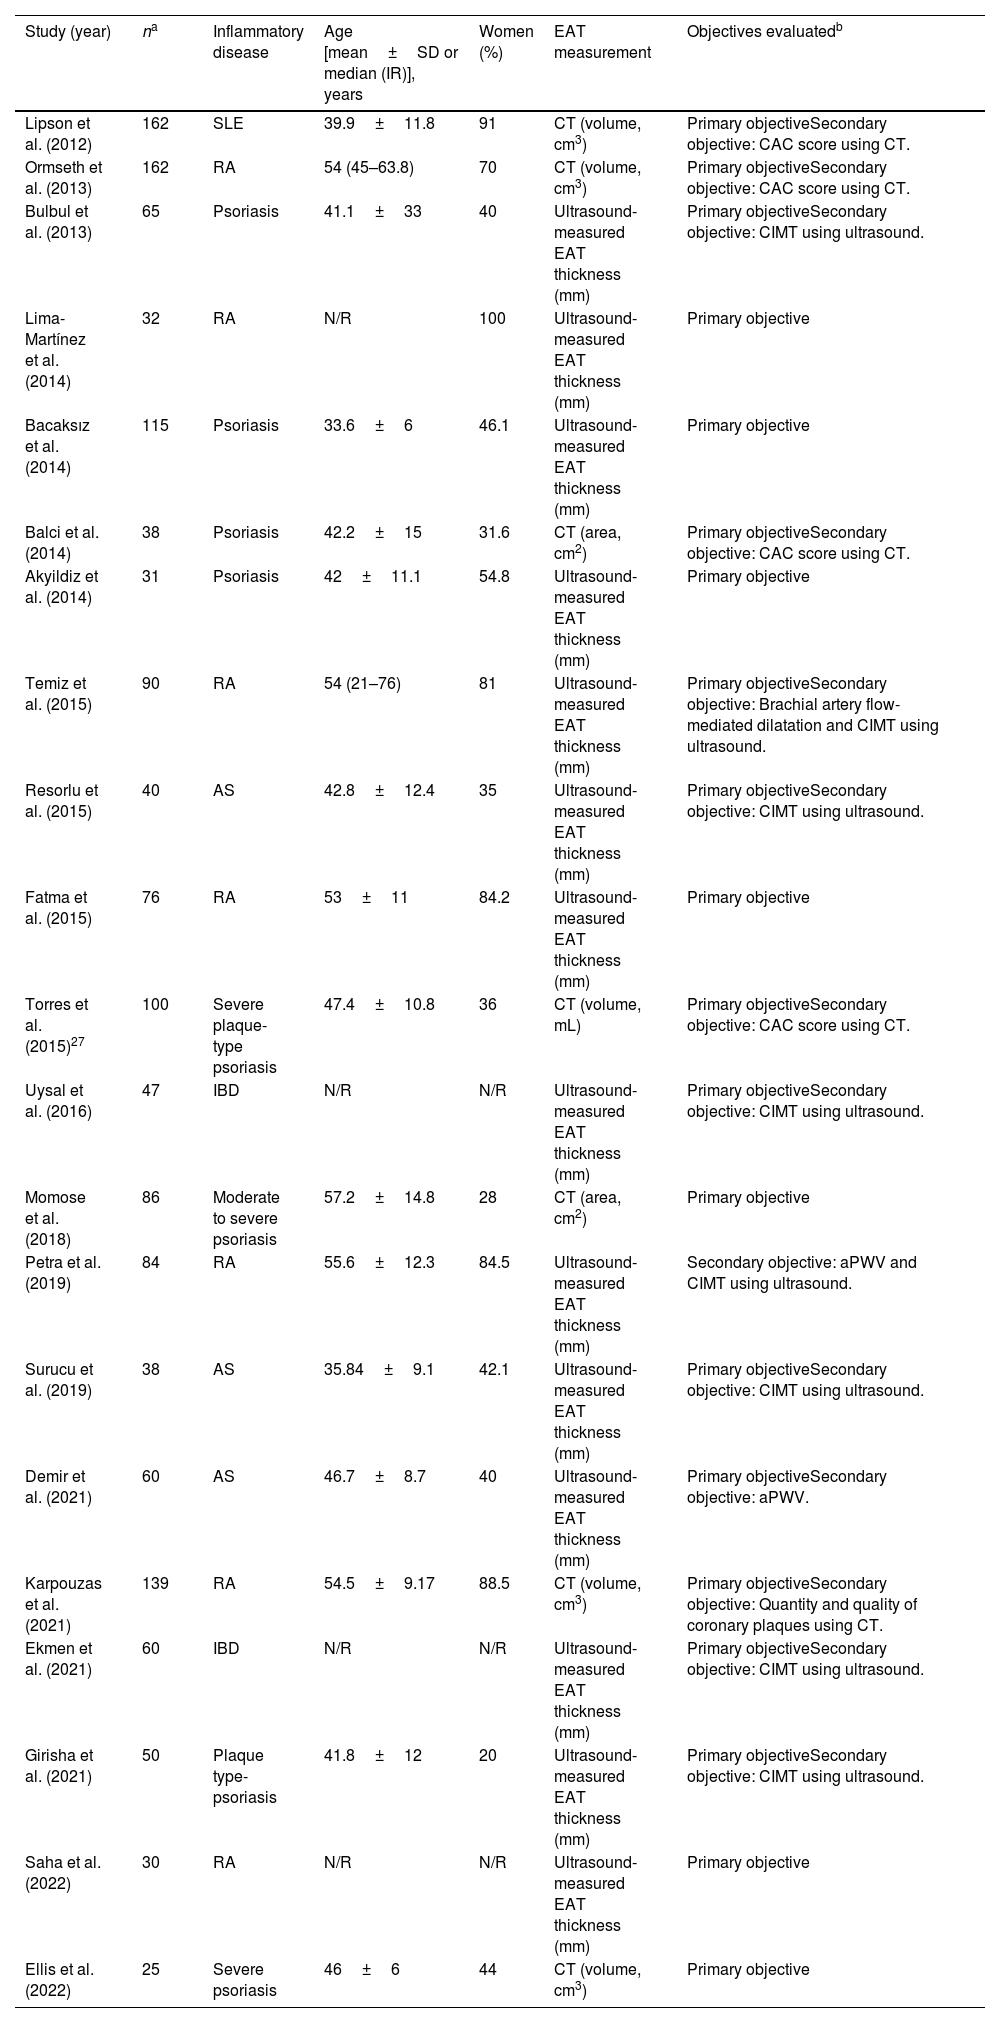
Twenty-one observational studies including 1448 patients with systemic inflammatory diseases were identified and considered eligible for this systematic review (for the quantitative analysis, 20 studies were selected).10–30 The systemic inflammatory diseases evaluated were psoriasis (8 studies), RA (7 studies), AS (3 studies), IBD (2 studies) and SLE (one study). The characteristics of the studies included in this review are shown in Table 1.
Characteristics of the included observational studies.
| Study (year) | na | Inflammatory disease | Age [mean±SD or median (IR)], years | Women (%) | EAT measurement | Objectives evaluatedb |
|---|---|---|---|---|---|---|
| Lipson et al. (2012) | 162 | SLE | 39.9±11.8 | 91 | CT (volume, cm3) | Primary objectiveSecondary objective: CAC score using CT. |
| Ormseth et al. (2013) | 162 | RA | 54 (45–63.8) | 70 | CT (volume, cm3) | Primary objectiveSecondary objective: CAC score using CT. |
| Bulbul et al. (2013) | 65 | Psoriasis | 41.1±33 | 40 | Ultrasound-measured EAT thickness (mm) | Primary objectiveSecondary objective: CIMT using ultrasound. |
| Lima-Martínez et al. (2014) | 32 | RA | N/R | 100 | Ultrasound-measured EAT thickness (mm) | Primary objective |
| Bacaksız et al. (2014) | 115 | Psoriasis | 33.6±6 | 46.1 | Ultrasound-measured EAT thickness (mm) | Primary objective |
| Balci et al. (2014) | 38 | Psoriasis | 42.2±15 | 31.6 | CT (area, cm2) | Primary objectiveSecondary objective: CAC score using CT. |
| Akyildiz et al. (2014) | 31 | Psoriasis | 42±11.1 | 54.8 | Ultrasound-measured EAT thickness (mm) | Primary objective |
| Temiz et al. (2015) | 90 | RA | 54 (21–76) | 81 | Ultrasound-measured EAT thickness (mm) | Primary objectiveSecondary objective: Brachial artery flow-mediated dilatation and CIMT using ultrasound. |
| Resorlu et al. (2015) | 40 | AS | 42.8±12.4 | 35 | Ultrasound-measured EAT thickness (mm) | Primary objectiveSecondary objective: CIMT using ultrasound. |
| Fatma et al. (2015) | 76 | RA | 53±11 | 84.2 | Ultrasound-measured EAT thickness (mm) | Primary objective |
| Torres et al. (2015)27 | 100 | Severe plaque-type psoriasis | 47.4±10.8 | 36 | CT (volume, mL) | Primary objectiveSecondary objective: CAC score using CT. |
| Uysal et al. (2016) | 47 | IBD | N/R | N/R | Ultrasound-measured EAT thickness (mm) | Primary objectiveSecondary objective: CIMT using ultrasound. |
| Momose et al. (2018) | 86 | Moderate to severe psoriasis | 57.2±14.8 | 28 | CT (area, cm2) | Primary objective |
| Petra et al. (2019) | 84 | RA | 55.6±12.3 | 84.5 | Ultrasound-measured EAT thickness (mm) | Secondary objective: aPWV and CIMT using ultrasound. |
| Surucu et al. (2019) | 38 | AS | 35.84±9.1 | 42.1 | Ultrasound-measured EAT thickness (mm) | Primary objectiveSecondary objective: CIMT using ultrasound. |
| Demir et al. (2021) | 60 | AS | 46.7±8.7 | 40 | Ultrasound-measured EAT thickness (mm) | Primary objectiveSecondary objective: aPWV. |
| Karpouzas et al. (2021) | 139 | RA | 54.5±9.17 | 88.5 | CT (volume, cm3) | Primary objectiveSecondary objective: Quantity and quality of coronary plaques using CT. |
| Ekmen et al. (2021) | 60 | IBD | N/R | N/R | Ultrasound-measured EAT thickness (mm) | Primary objectiveSecondary objective: CIMT using ultrasound. |
| Girisha et al. (2021) | 50 | Plaque type-psoriasis | 41.8±12 | 20 | Ultrasound-measured EAT thickness (mm) | Primary objectiveSecondary objective: CIMT using ultrasound. |
| Saha et al. (2022) | 30 | RA | N/R | N/R | Ultrasound-measured EAT thickness (mm) | Primary objective |
| Ellis et al. (2022) | 25 | Severe psoriasis | 46±6 | 44 | CT (volume, cm3) | Primary objective |
aPWV: aortic pulse wave velocity; AS: ankylosing spondylitis; BMI: body mass index; CAC: coronary artery calcification; CAD: coronary artery disease; CHF: congestive heart failure; CIMT: intima-media thickness, CKD: chronic kidney disease; COPD: chronic obstructive pulmonary disease; CRP: C-reactive protein; CT: computed tomography; CVD: cardiovascular disease; EAT: epicardial adipose tissue; IBD: inflammatory bowel disease; IR: interquartile range; N/R: not reported; RA: rheumatoid arthritis; SLE: systemic lupus erythematosus.
The risk of bias assessment of the studies included in this review is shown in Fig. 2.

The analytical evaluation (Egger's asymmetry test) does not suggest publication bias (EAT volume studies: p=0.29; EAT thickening studies: p=0.96).
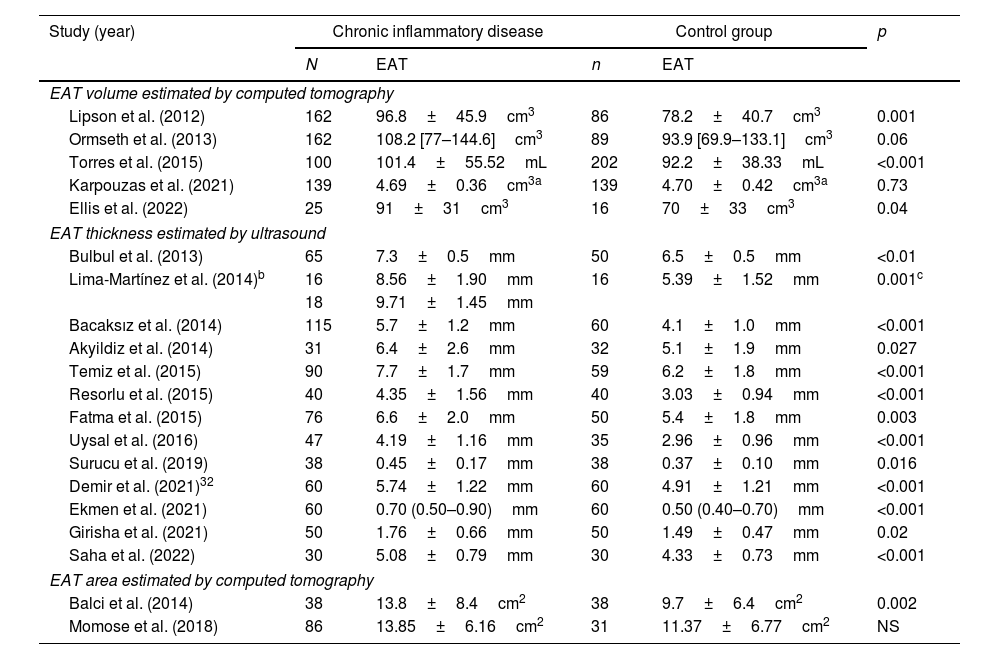
EAT in patients with systemic inflammatory diseases versus controlsIn total, five studies compared the volume of EAT observed by computed tomography between patients with systemic inflammatory diseases and a control group.10,11,16,23,29 Three studies showed a significantly higher volume of EAT in patients with systemic inflammatory diseases compared to controls10,23,29 while another two did not.11,25 On the other hand, two studies evaluated the area of EAT estimated by computed tomography. One study showed a significantly higher area of EAT in patients with systemic inflammatory diseases compared to controls,22 while another did not.21 In addition, 13 studies evaluated EAT thickness by ultrasound in both groups (subjects with systemic inflammatory disease and controls).13–18,22,23,26–28 All studies showed a significantly higher EAT thickness in patients with systemic inflammatory diseases compared to controls. The estimation of different variables regarding EAT in patients with systemic inflammatory diseases and controls is shown in Table 2.
Epicardial adipose tissue in patients with chronic inflammatory diseases and controls.
| Study (year) | Chronic inflammatory disease | Control group | p | ||
|---|---|---|---|---|---|
| N | EAT | n | EAT | ||
| EAT volume estimated by computed tomography | |||||
| Lipson et al. (2012) | 162 | 96.8±45.9cm3 | 86 | 78.2±40.7cm3 | 0.001 |
| Ormseth et al. (2013) | 162 | 108.2 [77–144.6]cm3 | 89 | 93.9 [69.9–133.1]cm3 | 0.06 |
| Torres et al. (2015) | 100 | 101.4±55.52mL | 202 | 92.2±38.33mL | <0.001 |
| Karpouzas et al. (2021) | 139 | 4.69±0.36cm3a | 139 | 4.70±0.42cm3a | 0.73 |
| Ellis et al. (2022) | 25 | 91±31cm3 | 16 | 70±33cm3 | 0.04 |
| EAT thickness estimated by ultrasound | |||||
| Bulbul et al. (2013) | 65 | 7.3±0.5mm | 50 | 6.5±0.5mm | <0.01 |
| Lima-Martínez et al. (2014)b | 16 | 8.56±1.90mm | 16 | 5.39±1.52mm | 0.001c |
| 18 | 9.71±1.45mm | ||||
| Bacaksız et al. (2014) | 115 | 5.7±1.2mm | 60 | 4.1±1.0mm | <0.001 |
| Akyildiz et al. (2014) | 31 | 6.4±2.6mm | 32 | 5.1±1.9mm | 0.027 |
| Temiz et al. (2015) | 90 | 7.7±1.7mm | 59 | 6.2±1.8mm | <0.001 |
| Resorlu et al. (2015) | 40 | 4.35±1.56mm | 40 | 3.03±0.94mm | <0.001 |
| Fatma et al. (2015) | 76 | 6.6±2.0mm | 50 | 5.4±1.8mm | 0.003 |
| Uysal et al. (2016) | 47 | 4.19±1.16mm | 35 | 2.96±0.96mm | <0.001 |
| Surucu et al. (2019) | 38 | 0.45±0.17mm | 38 | 0.37±0.10mm | 0.016 |
| Demir et al. (2021)32 | 60 | 5.74±1.22mm | 60 | 4.91±1.21mm | <0.001 |
| Ekmen et al. (2021) | 60 | 0.70 (0.50–0.90)mm | 60 | 0.50 (0.40–0.70)mm | <0.001 |
| Girisha et al. (2021) | 50 | 1.76±0.66mm | 50 | 1.49±0.47mm | 0.02 |
| Saha et al. (2022) | 30 | 5.08±0.79mm | 30 | 4.33±0.73mm | <0.001 |
| EAT area estimated by computed tomography | |||||
| Balci et al. (2014) | 38 | 13.8±8.4cm2 | 38 | 9.7±6.4cm2 | 0.002 |
| Momose et al. (2018) | 86 | 13.85±6.16cm2 | 31 | 11.37±6.77cm2 | NS |
Continuous variables are presented as median [interquartile range] or mean±standard deviation.
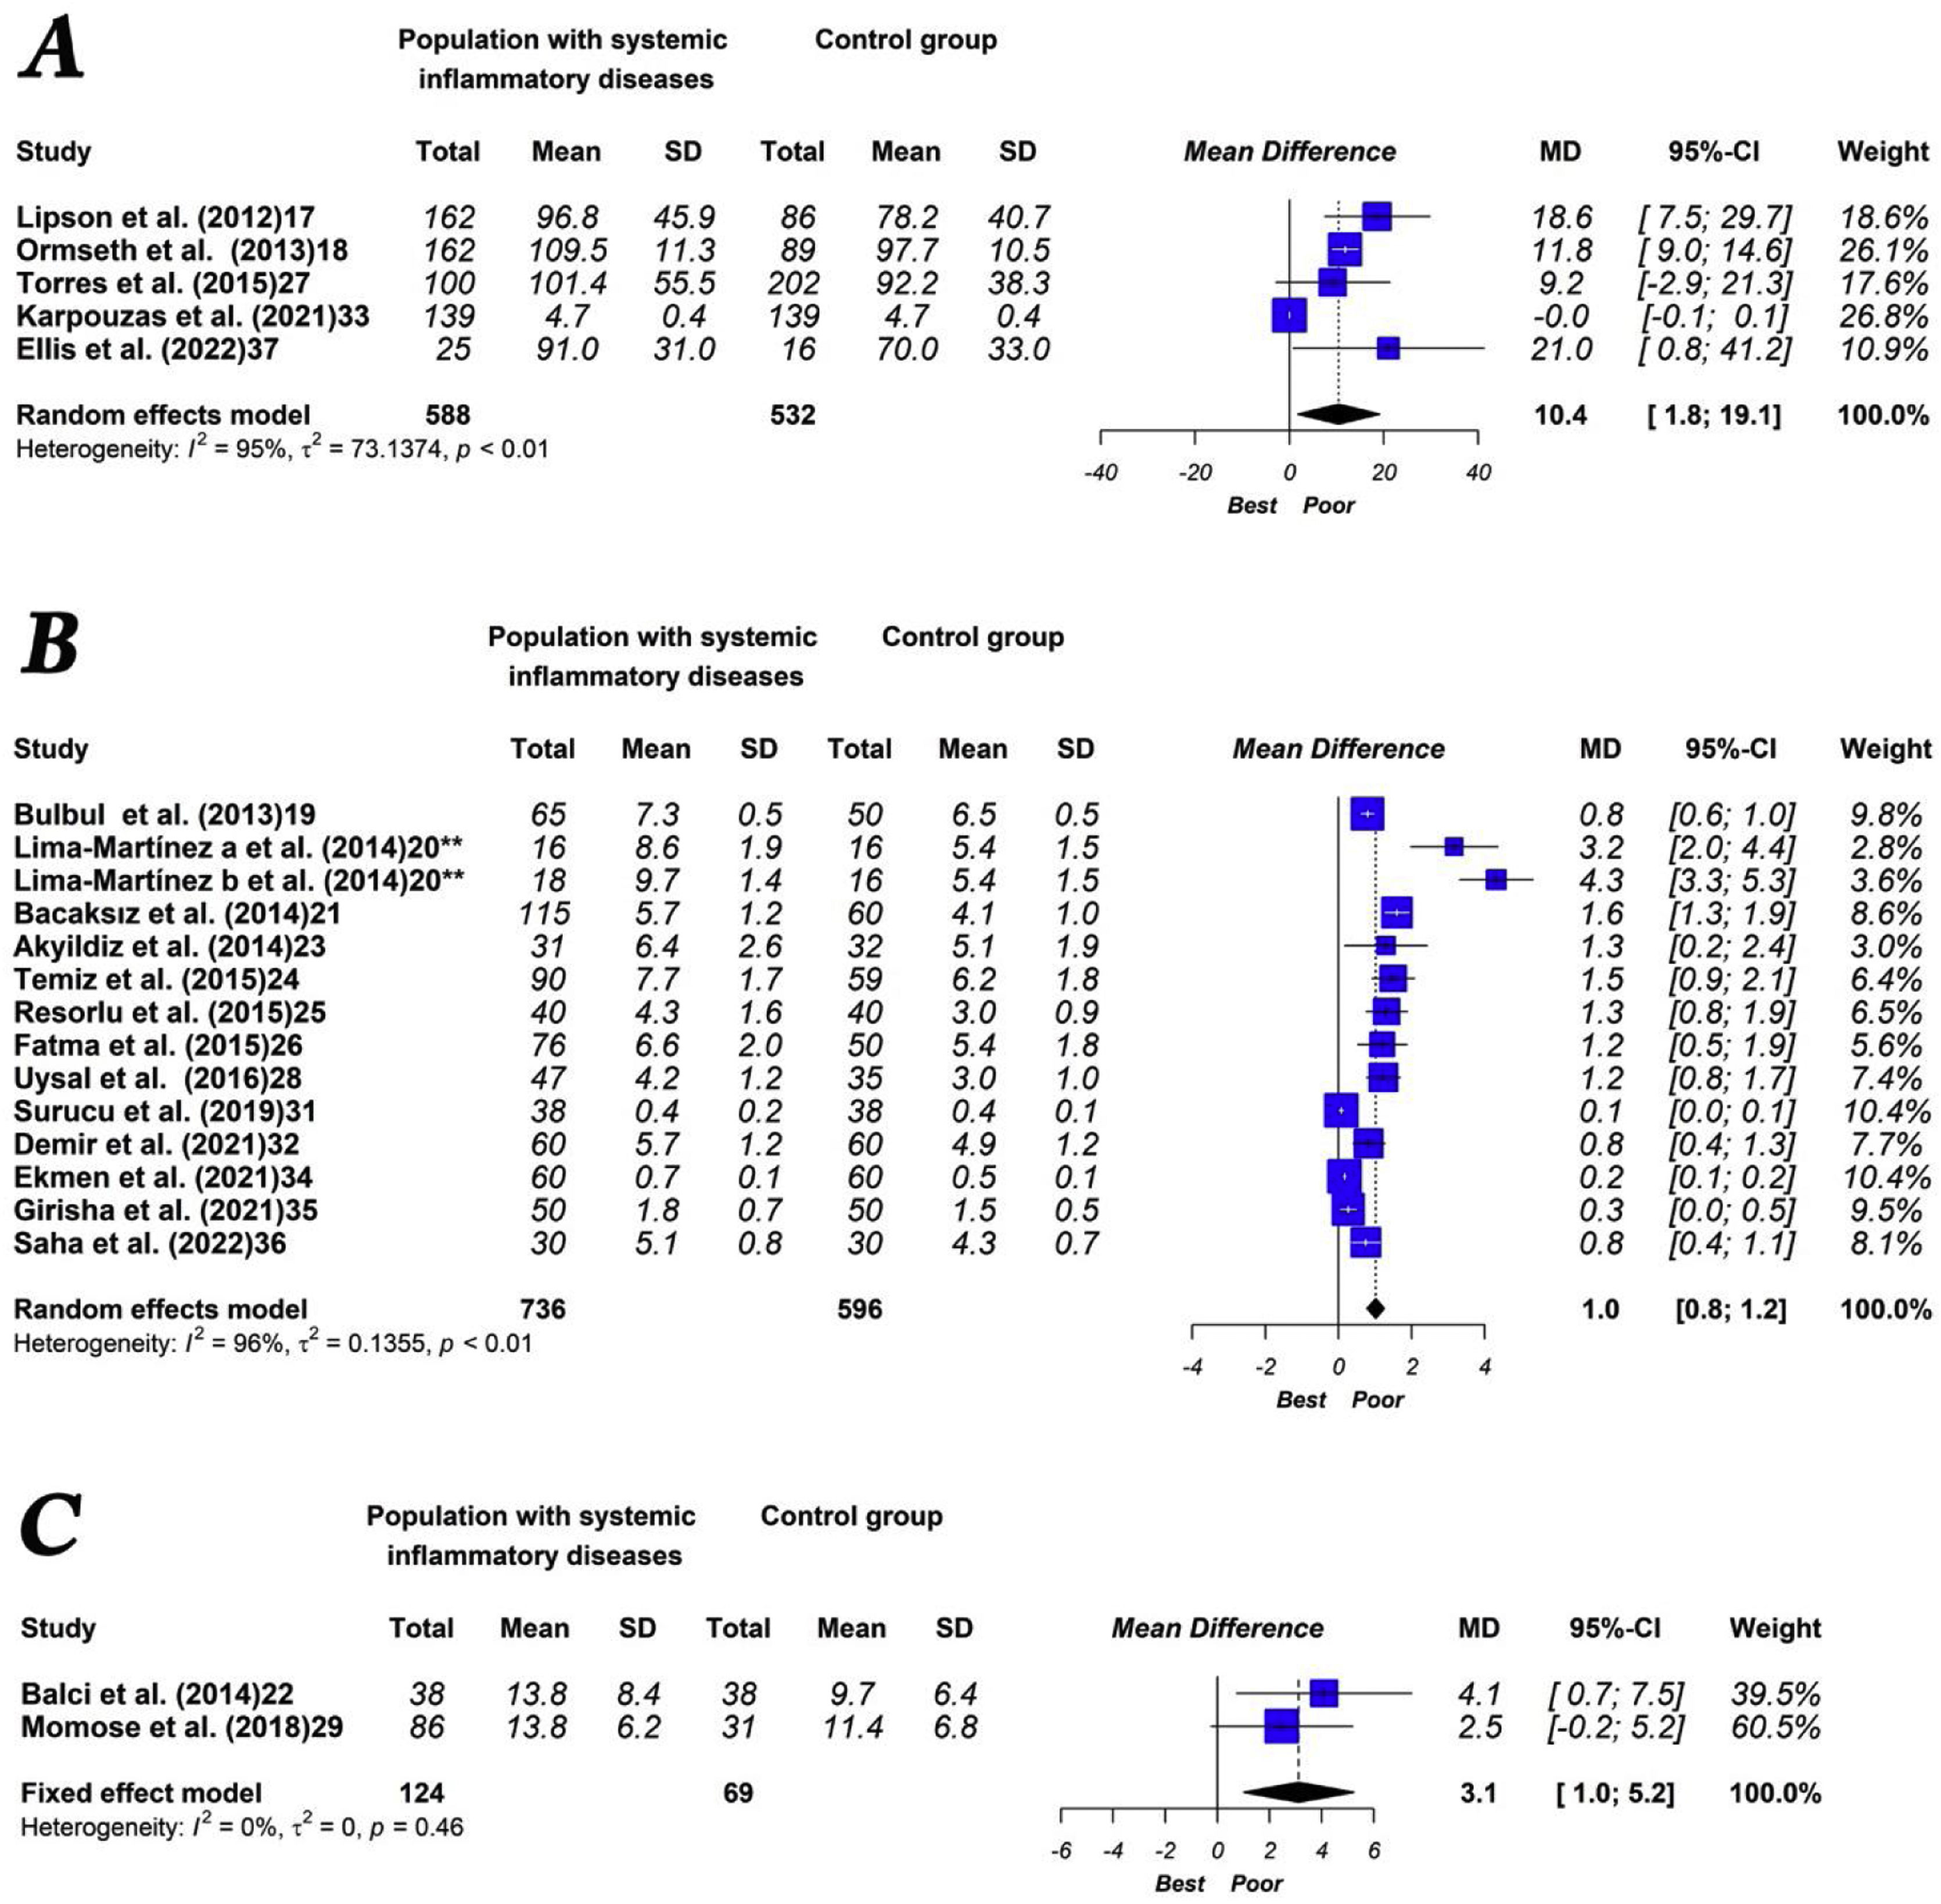
The quantitative analysis showed that patients with systemic inflammatory disease have a higher volume (MD: 10.4cm3 [1.8–19.1]; p<0.01, I2=95%) and higher thickness (MD: 1.0mm [0.8–1.2]; p<0.01, I2=96%) of EAT compared to the control group. Moreover, patients with systemic inflammatory diseases showed a statistically non-significant higher EAT area than the control group (MD: 3.1cm2 [1.0–5.2]; p=0.46, I2=0%). The main results of the meta-analysis are shown in Fig. 3.
 EAT volume; (B) EAT thickness; (C) EAT area. Random effects, mean difference (MD), 95% confidence intervals (CI) and I2 statistics. EAT: epicardial adipose tissue; SD: standard deviation.")
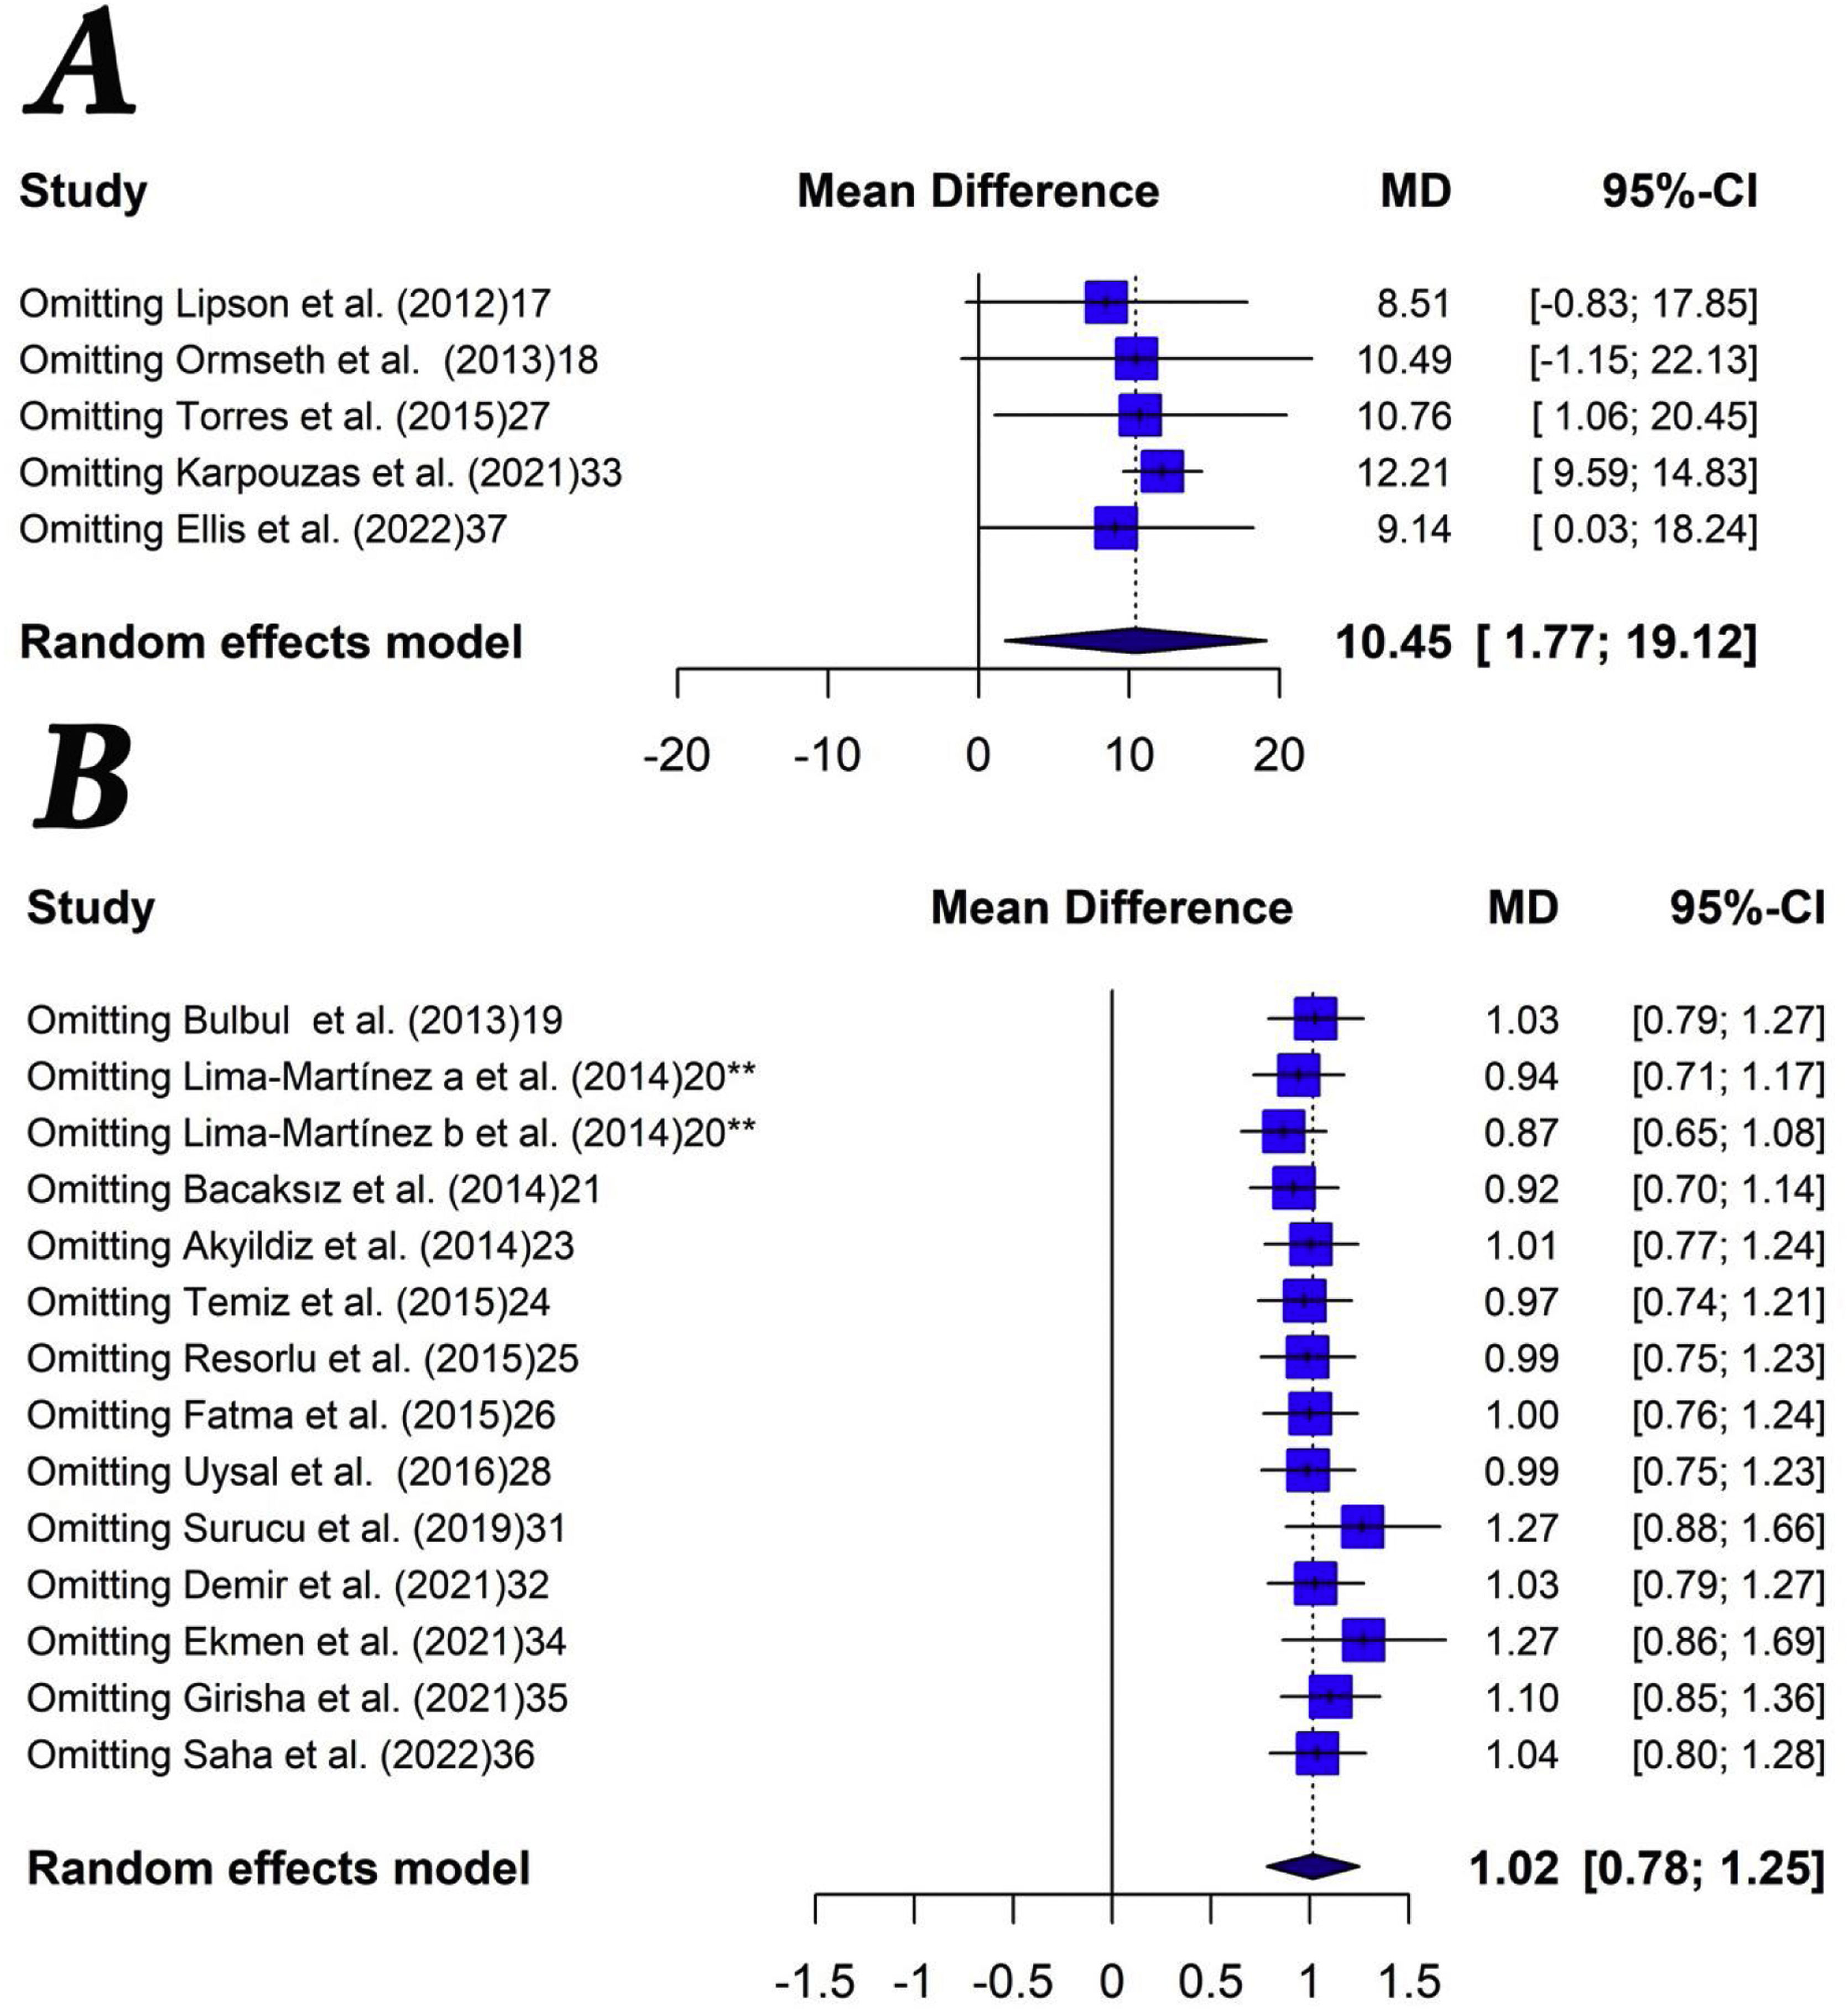
In this case of EAT volume, the influence analysis shows that the heterogeneity decreases drastically (I2=0%) when eliminating the study by Karpouzaset al. On the other hand, in the analysis of the influence of EAT thickness, the heterogeneity decreased slightly in all cases, without observing that any particular study significantly changed the result.
Sensitivity analysis showed robust results when evaluating EAT thickening (Fig. 4). When performing the same analysis but with the studies that evaluated EAT volume, the results were similar, although omitting the studies by Lipson et al. and Omset et al. the trend lost statistical significance. We did not perform sensitivity analysis with the investigations that evaluated the area of EAT because there were only two studies.
Association between EAT and the presence of subclinical atheromatosis EAT thickness; (B) EAT volume.")
Four studies that included patients with psoriasis have evaluated this point. Bulbul et al. showed that EAT thickness was significantly correlated with CIMT (r=0.69, p<0.01) in patients with psoriasis vulgaris.13 Another study reported a moderately positive correlation between EAT thickness and CIMT in subjects with chronic plaque psoriasis (p<0.05).27 In addition, the area of EAT was significantly associated with the presence of CAC in another study.14 Similarly, EAT volume was positively related to CAC in patients with severe plaque-type psoriasis.19 This study showed that EAT volume was significantly higher in patients with subclinical atherosclerosis compared to those without any degree of coronary calcification (135.7±8.39mL vs. 75.6±5.29mL, p<0.001), even after adjustment for confounding variables.
Four other studies that included patients with RA have evaluated this objective. Temiz et al. reported a positive correlation between EAT thickness and CIMT (p<0.001) and a negative correlation between EAT and brachial artery flow-mediated dilatation (p=0.001) in a group of patients with RA.16 Petra et al. showed that the correlation analysis displayed a significant positive correlation between EAT and aPWV (p<0.001) and between EAT and CIMT (p=0.002). In addition, patients with increased aPWV had significantly higher EAT thickness compared to those with normal aPWV (0.26 [0.23–0.31] vs. 0.21 [0.19–0.27], p<0.001). Patients with an EAT>0.21mm showed an increased aPWV approximately 10 times more frequently (adjusted OR: 10.9, 95% CI 2.1–57.8, p=0.005).30
Another study reported that patients with coronary atherosclerosis had higher adjusted EAT volume compared to those without coronary atherosclerosis (4.72 [95% CI 4.66–4.78] vs. 4.59 [95% CI 4.48–4.69], p=0.046). Each 1−SD log-unit increase in EAT volume was associated with a 63% higher likelihood of multivessel or obstructive disease presence (adjusted OR=1.63 [95% CI 1.04–2.61], p=0.033). Also, EAT volume (per 1−SD log-increment) was associated with presence of noncalcified plaque (adjusted OR=1.78 [95% CI 1.17–2.70], p=0.007), mixed plaque (adjusted OR=2.07 [95% CI 1.25–3.43], p=0.005) and vulnerable plaque (adjusted OR=1.77 [95% CI 1.03–3.04], p=0.038).25 In contrast, CAC score was not significantly correlated with EAT volume in unadjusted or adjusted analysis in another small study.20
Three other studies evaluated the association between EAT and subclinical atheromatosis in patients with AS. Two studies reported a significant correlation between EAT thickness and CIMT.17,22 Likewise, a significant positive correlation was detected between EAT thickness and aPWV (p<0.001) in another study published by Demir et al.24
Similarly, there was a strong positive correlation between EAT thickness and CIMT in the two studies evaluating IBD patients.20,26
Finally, Lipson et al. showed that EAT volume was positively correlated with CAC score (p<0.001) in patients with SLE.10 In addition, after adjustment for Framingham risk score and waist circumference, the association remained significant (p=0.04).
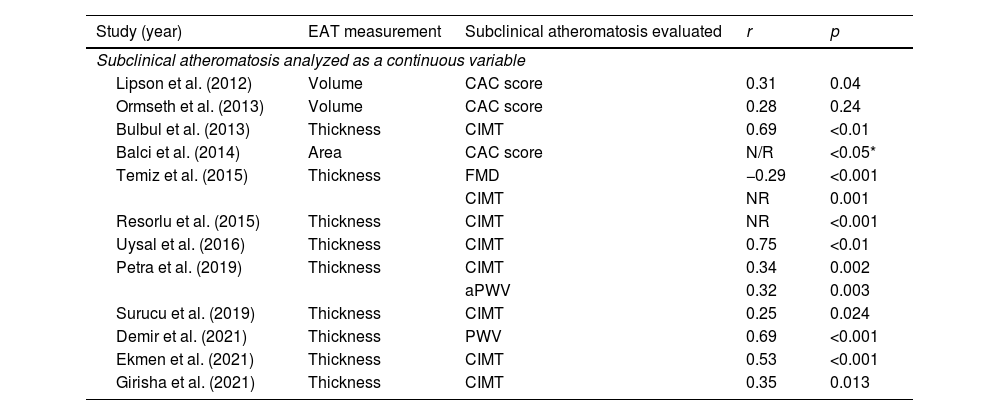
The main findings related to the second objective of this systematic review are shown in Table 3.
Main findings of the association between EAT and subclinical atheromatosis.
| Study (year) | EAT measurement | Subclinical atheromatosis evaluated | r | p |
|---|---|---|---|---|
| Subclinical atheromatosis analyzed as a continuous variable | ||||
| Lipson et al. (2012) | Volume | CAC score | 0.31 | 0.04 |
| Ormseth et al. (2013) | Volume | CAC score | 0.28 | 0.24 |
| Bulbul et al. (2013) | Thickness | CIMT | 0.69 | <0.01 |
| Balci et al. (2014) | Area | CAC score | N/R | <0.05* |
| Temiz et al. (2015) | Thickness | FMD | −0.29 | <0.001 |
| CIMT | NR | 0.001 | ||
| Resorlu et al. (2015) | Thickness | CIMT | NR | <0.001 |
| Uysal et al. (2016) | Thickness | CIMT | 0.75 | <0.01 |
| Petra et al. (2019) | Thickness | CIMT | 0.34 | 0.002 |
| aPWV | 0.32 | 0.003 | ||
| Surucu et al. (2019) | Thickness | CIMT | 0.25 | 0.024 |
| Demir et al. (2021) | Thickness | PWV | 0.69 | <0.001 |
| Ekmen et al. (2021) | Thickness | CIMT | 0.53 | <0.001 |
| Girisha et al. (2021) | Thickness | CIMT | 0.35 | 0.013 |
| Study (year) | EAT measurement | Subclinical atheromatosis evaluated | Cut-off point | OR or p value |
|---|---|---|---|---|
| Subclinical atheromatosis analyzed as a dichotomous variable | ||||
| Torres et al. (2015) | Volume | CAC score | Agatston score>0 | p=0.004 |
| Petra et al. (2019) | Thickness | aPWV | aPWV>10m/s | p<0.01 |
| Karpouzas et al. (2021) | Volume | Non-calcified plaque | Presence or absence of plaque | OR=1.78, p=0.007 |
| Mixed plaque | OR=2.07, p=0.005 | |||
| Vulnerable plaque | OR=1.77, p=0.038 | |||
| Calcified plaque | OR=1.60, p=0.174 | |||
aPWV: aortic pulse wave velocity; CIMT: carotid intima-media thickness; CAC: coronary artery calcium; EAT: epicardial adipose tissue; FMD: flow mediated dilatation.
This systematic review included the full body of evidence that examined the relationship between EAT and systemic inflammatory diseases. The results of this study suggest that EAT increased significantly in patients with systemic inflammatory disease compared with controls. Likewise, most of the studies evaluated observed an association between EAT and subclinical atheromatosis.
Multiple pathogenic mechanisms have been proposed to explain the higher cardiovascular risk observed in patients with systemic inflammatory diseases20–29: (a) an overall increased frequency of traditional cardiovascular risk factors; (b) elevated proinflammatory cytokines (inflammation); (c) the presence of auto-antibodies; (d) alterations of the intestinal microbiota. EAT is recognized as a metabolically active endocrine organ and has been proposed as an emerging risk factor for cardiovascular diseases. In this context, the deleterious properties of EAT could also be a mechanism related to the atherosclerotic disease observed more frequently in these patients.
The mechanisms that explain the EAT increase observed in patients with systemic inflammatory diseases are not fully understood. Immune-mediated chronic systemic inflammation may be responsible for this phenomenon.22 In addition, it has been postulated that a mass-dependent mechanism could determine the predominance of some of these effects.30
When we analyzed the studies included in this review individually, three studies showed a higher EAT volume in subjects with systemic inflammatory diseases,10,17,27 while another study showed a non-significant trend.20 Only the study published by Karpouzas et al. showed no differences between the groups evaluated. The reasons to explain this finding could be related to the fact that this study included a non-RA comparison group who were not healthy volunteers. In addition, a large proportion of RA patients received TNFi and statin therapy, both drugs that could positively impact EAT.12 When analyzing the studies that measured the area of EAT, one study reported that patients with systemic inflammatory disease showed a greater area of EAT compared to a control group.14 Another study found no significant differences between patients with psoriasis and controls, although it did report that the subgroup of patient sunder 50 years of age with psoriasis showed a much higher area of EAT than non-psoriatic subjects.22 On the other hand, the measurement of EAT thickness was homogeneously higher in patients with systemic inflammatory diseases. Likewise, the results of the quantitative analysis were similar regardless of the method used.
Macroscopic EAT deposition is strongly associated with obesity and insulin resistance.30 In addition, Aitken-Buck et al. have found that despite a strong positive correlation of EAT with body mass index, epicardial adipocyte size does not increase concurrently, suggesting that adipocyte hyperplasia might be the predominant EAT remodeling mechanism.20 Although body weight could act as a confounder in our work, body mass index was similar when comparing subjects with chronic inflammatory diseases with controls in 19 of the 20 studies that reported this data. The study by Girisha et al. was the exception, although the body mass index analyzed as a dichotomous variable (>25) was not associated with EAT. Likewise, waist circumference was not different between patients with inflammatory diseases and controls in 8 of the 10 studies that reported this data. Finally, we have not found great differences in age (1/20), sex (1/17), HDL-C levels (1/15), LDL-C levels (1/15), triglyceride levels (1/15) and prevalence of hypertension (1/10) or diabetes (0/8) when we compare the groups with chronic inflammatory diseases and controls in the included studies.
A previously published meta-analysis showed that patients with systemic inflammatory diseases have higher EAT than control subjects.30 However, it analyzed five studies that included only patients with psoriasis. In contrast, our study evaluated 21 studies that included different systemic inflammatory diseases.
Different measurements of subclinical atheromatosis are well-accepted early surrogate markers for cardiovascular disease and improving the cardiovascular risk prediction models. In this context, this systematic review showed that almost all the studies evaluated reported a significant association between EAT (thickness, area or volume) and subclinical atheromatosis in patients with different systemic inflammatory disease. In fact, a positive correlation between EAT and CIMT, aPWV or CAC, and a negative correlation between EAT and brachial artery flow-mediated dilatation was observed.
This systematic review has some limitations. Firstly, quantitative analysis (meta-analysis) was not possible for the secondary objective because the reported measures of exposure and effect were different. Secondly, statistical heterogeneity was very high in two of the three comparisons. Despite its common use in the literature, I2 is not a perfect measure for heterogeneity and its value still heavily depends on the precision and size of the included studies.24 In extreme cases, very high heterogeneity can mean that the studies have nothing in common, and that it makes no sense to interpret the pooled effect at all. In other cases, the result of a particular study may alter the inconsistency value. This could be concluded in the case of the EAT volume analysis, where the neutral result of the study by Karpouzas et al. significantly increased the heterogeneity. On the other hand, all studies in this review showed greater EAT thickness in patients with systemic inflammatory disease, suggesting in this case that the heterogeneity was more related to the magnitude of the effect (mean differences) than to the direction of the effect. Thirdly, the studies included in our analysis were all observational, and consequently, the presence of biases and confounders was highly expected. Finally, the different inflammatory diseases were analyzed together. Individual analysis was not performed because some pathologies were represented by very few studies. Analyzing “systemic inflammatory diseases” as a construct is a weakness of this study since the diseases exhibits very differentiated pathogenic mechanisms, even for inflammatory immune pathways. Despite these limitations, this study analyzed the best evidence available to date on this topic.
ConclusionThis study demonstrated that EAT is increased in patients with systemic inflammatory diseases compared with healthy controls and that EAT measurement is closely correlated with subclinical atherosclerosis in these patients. Whether or not the association observed in this systematic review is causal should be evaluated in prospective studies.
Availability of data and materialThe data underlying this article are available in the article and in its online supplementary material.
Author contributionsWM and ALC participated in the conception and design of the research. WM, LB and ALC participated in the data collection. The interpretation of the data and the statistical analysis was done by WM, ML and JPN. WM, LB, and JPN drafted the manuscript. All authors performed a critical review of the final document. All authors have read and agreed to the published version of the manuscript.
FundingThis research did not receive any specific grant from funding agencies in the public, commercial, or not-for-profit sectors.
Conflicts of interestThe authors declare that they have no conflict of interest.
We are grateful to Gaborit Benedict at the Endocrinology, Metabolic Diseases and Nutrition Department, Assistance Publique Hôpitaux de Marseille, France, being part of the faculty of health sciences for performing the systematic search, and we thank for proofreading the manuscript.


