The chronic nature of musculoskeletal diseases requires an integrated care which involves the Primary Care and the specialities of Rheumatology, Traumatology and Rehabilitation. The aim of this study was to assess the implementation of an integrated organizational model in osteoporosis, low back pain, shoulder disease and knee disease using Deming's continuous improvement process and considering referrals and resource consumption.
Material and methodsA simulation model was used in the planning to predict the evolution of musculoskeletal diseases resource consumption and to carry out a Budget Impact Analysis from 2012 to 2020 in the Goierri-Alto Urola region. In the checking stage the status of the process in 2014 was evaluated using statistical analysis to check the degree of achievement of the objectives for each speciality.
ResultsSimulation models showed that population with musculoskeletal disease in Goierri-Alto Urola will increase a 4.4% by 2020. Because of that, the expenses for a conventional healthcare system will have increased a 5.9%. However, if the intervention reaches its objectives the budget would decrease an 8.5%. The statistical analysis evidenced a decline in referrals to Traumatology service and a reduction of successive consultations in all specialities.
DiscussionThe implementation of the integrated organizational model in osteoporosis, low back pain, shoulder disease and knee disease is still at an early stage. However, the empowerment of Primary Care improved patient referrals and reduced the costs.
El carácter crónico de las enfermedades del aparato locomotor requieren una atención integrada de atención primaria y las especialidades de reumatología, traumatología y rehabilitación. El objetivo del trabajo fue evaluar la implementación de un modelo organizativo integrado de gestión de la osteoporosis, lumbalgia, enfermedades del hombro y enfermedades de la rodilla mediante el proceso de mejora continua de Deming, teniendo en cuenta las derivaciones y el consumo de recursos.
Material y métodosEn la fase de planificación se utilizó un modelo de simulación para predecir la evolución del consumo de recursos en cada enfermedad del aparato locomotor y realizar un análisis del impacto presupuestario desde 2012 hasta 2020 en la comarca Goierri-Alto Urola. En la etapa de revisión se evaluó el estado del proceso en 2014 utilizando el análisis estadístico para comprobar el grado de consecución de los objetivos para cada enfermedad.
ResultadosSegún el modelo de simulación la población de pacientes con enfermedad osteomuscular aumentará en un 4,4% en 2020, con un incremento en costes para un sistema convencional de un 5,9%. Si la intervención integrada alcanzase sus objetivos este presupuesto se reduciría en un 8,5%. El análisis estadístico evidenció un descenso de derivaciones a traumatología y una reducción de consultas sucesivas en todas las especialidades.
DiscusiónLa implementación del modelo integrado en las enfermedades de osteoporosis, lumbalgia, hombro y rodilla está todavía en un estadio inicial. Sin embargo, el empoderamiento de la atención primaria mejoró la derivación de pacientes y redujo ligeramente los costes.
The increase in the prevalence of chronic diseases due to aging is bringing about a change in the organization of health services.1–3 Integrated health care delivery is a new approach aimed at correcting the fragmentation of traditional health systems.4–6 These new organizational models have been regularly applied in programs for the care of frail, chronically ill patients.7,8 In contrast, in the field of the musculoskeletal system there is little literature on the integration of primary care (PC) and hospital care (HC), despite the fact that musculoskeletal disease is the most common reason for referral from PC and frequently results in waiting lists.9 Moreover, the chronic nature of many of these diseases means that patients have a recurrent relationship with PC and the specialties of rheumatology, orthopedics and rehabilitation.4,10
The creation of integrated health care organizations (IHCO) in the health system of the Basque Country, in northern Spain, promoted the integration of PC and HC through a management plan focusing on the patient that was also applied to the musculoskeletal system.11 Along these lines, in the Goierri-Alto Urola IHCO, a new model of integrated clinical care was launched in terms of the development of common health care pathways established by a multidisciplinary group composed of rheumatologists, orthopedists, physical therapists and general practitioners, with the understanding that musculoskeletal diseases require a common approach on the part of all the professionals involved.12 The pathways brought together the major aspects of the management of patients with these diseases, as well as the indications for their referral to the specialties of rheumatology, orthopedics and rehabilitation.5,13 The new model was based on the empowerment of PC, enabling access of general practitioners to complex diagnostic tests like nuclear magnetic resonance and densitometry.14,15 Consultation via telephone was introduced to facilitate communication between different levels of care and avoid unnecessary patient traveling.16,17 This being a complex intervention signifies that getting it established is a challenge in which it is necessary to separate the efficacy of the intervention from its organizational deployment.18–20
The objective of this study was to evaluate the implementation of the integrated organizational model of management of musculoskeletal diseases in the IHCO, incorporating the use of simulation models and the statistical analysis of the continuous improvement process in Deming's Plan-Do-Check-Act (PDCA) framework.21,22
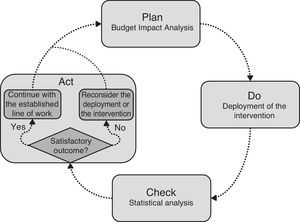
Material and MethodsThe present evaluation study was carried out using the large-scale databases (Big Data) of the administrative and clinical records of the Osakidetza, the Basque health service. Owing to the difficulty of evaluating complex interventions,18–20 we proposed a new evaluation design comparing the new intervention with the conventional model. For this purpose, the study was based on the PDCA approach, a classic management tool that consists in repeating a 4-phase continuous improvement process: Plan, Do, Check and Act.21,22 The proposed approach focused on giving substance to the Plan with a budget impact analysis (BIA) using a simulation model, and to Check it with a statistical analysis.23,24 The latter made it possible to represent the intervention specifying its impact according to the objectives.25 The second aided in testing the degree to which the objectives were attained and in observing the trend of the intervention, checking to see if the desired impact was being achieved. Fig. 1 shows how the BIA and statistical analysis were integrated within the framework of PDCA management. In accordance with this, we commenced at the situation prior to the deployment of the integrated model in 2012. The simulation was employed to predict the changes in the consumption of IHCO resources and to prepare a BIA covering 2012–2020 in 2 scenarios: baseline conditions and conditions after the intervention (Plan). In agreement with the proposal, once the deployment had been undertaken, the real costs should gradually converge toward the objective of the integrated model (Do). With the data from 2014, the status of the process was evaluated, utilizing the statistical analysis to compare it with the data from 2012 and confirm the degree to which the objectives had been achieved and the trend of the intervention (Check). Thus, depending on the results of the analysis, it would be possible to act accordingly, maintaining the project proposed or adjusting the deployment of the intervention (Act).
The Goierri-Alto Urola IHCO covers a catchment area with a total population of 95,000, and the sample analyzed included all the episodes of musculoskeletal system diseases attended to in PC (27,060 in 2012 and 27,462 in 2014) and HC (9358 in 2012 and 10,552 in 2014). Using the Adjusted Clinical Groups (ACG) system, we classified the musculoskeletal system diseases into 17 groups that can be seen in Table 1 of the online appendix, from which we created 2 groups that involved disorders affecting the shoulder and the knee.26 Although the integrated program can be implemented in all of the ACG groups, initially, the intervention included only 4 of them: osteoporosis, low back pain, disorders involving the shoulder and those involving the knee. The groups intervened were selected because those are the conditions associated with the greatest workload and resource consumption. In contrast, in the study, we analyzed all of the groups to demonstrate the impact of the intervention on the entire population of patients with musculoskeletal diseases. The intervention was limited to outpatients and did not influence the associated surgical hospital admissions.
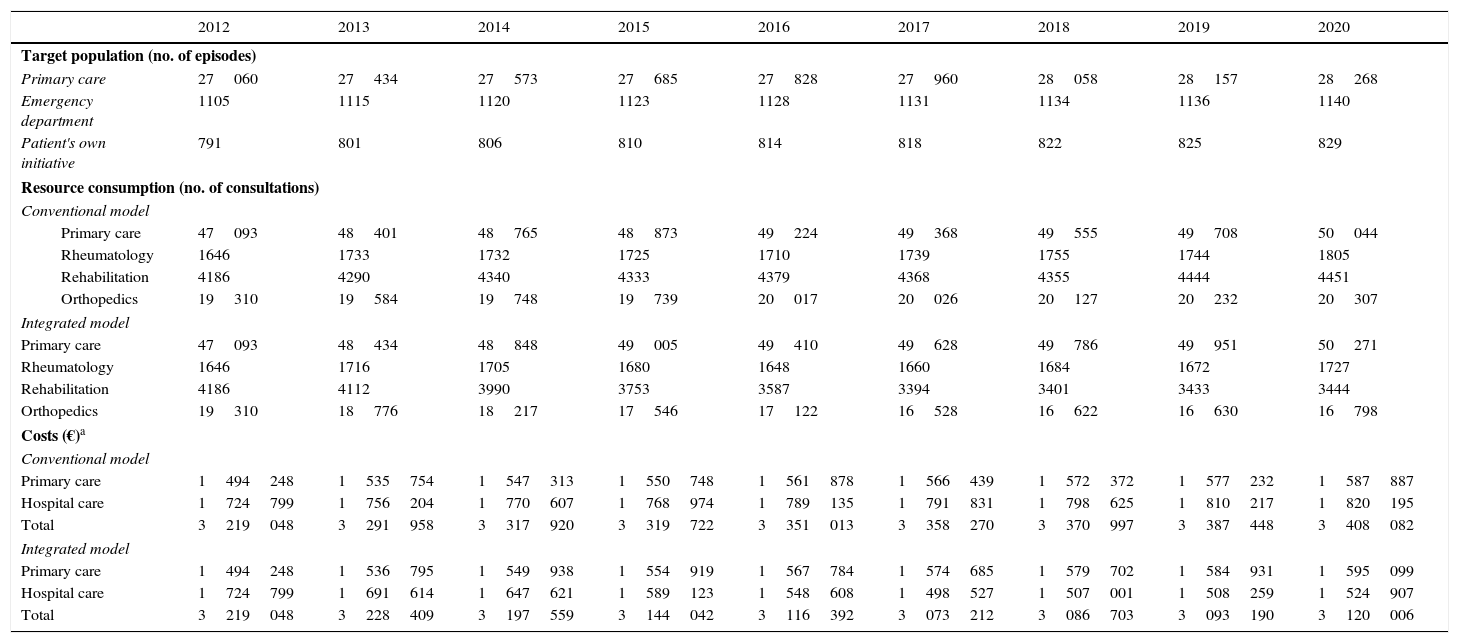
Extrapolation for 2012–2020 of the Target Population, the Number of Consultations According to the Organizative Model and the Budget Impact Analysis.
| 2012 | 2013 | 2014 | 2015 | 2016 | 2017 | 2018 | 2019 | 2020 | |
|---|---|---|---|---|---|---|---|---|---|
| Target population (no. of episodes) | |||||||||
| Primary care | 27060 | 27434 | 27573 | 27685 | 27828 | 27960 | 28058 | 28157 | 28268 |
| Emergency department | 1105 | 1115 | 1120 | 1123 | 1128 | 1131 | 1134 | 1136 | 1140 |
| Patient's own initiative | 791 | 801 | 806 | 810 | 814 | 818 | 822 | 825 | 829 |
| Resource consumption (no. of consultations) | |||||||||
| Conventional model | |||||||||
| Primary care | 47093 | 48401 | 48765 | 48873 | 49224 | 49368 | 49555 | 49708 | 50044 |
| Rheumatology | 1646 | 1733 | 1732 | 1725 | 1710 | 1739 | 1755 | 1744 | 1805 |
| Rehabilitation | 4186 | 4290 | 4340 | 4333 | 4379 | 4368 | 4355 | 4444 | 4451 |
| Orthopedics | 19310 | 19584 | 19748 | 19739 | 20017 | 20026 | 20127 | 20232 | 20307 |
| Integrated model | |||||||||
| Primary care | 47093 | 48434 | 48848 | 49005 | 49410 | 49628 | 49786 | 49951 | 50271 |
| Rheumatology | 1646 | 1716 | 1705 | 1680 | 1648 | 1660 | 1684 | 1672 | 1727 |
| Rehabilitation | 4186 | 4112 | 3990 | 3753 | 3587 | 3394 | 3401 | 3433 | 3444 |
| Orthopedics | 19310 | 18776 | 18217 | 17546 | 17122 | 16528 | 16622 | 16630 | 16798 |
| Costs (€)a | |||||||||
| Conventional model | |||||||||
| Primary care | 1494248 | 1535754 | 1547313 | 1550748 | 1561878 | 1566439 | 1572372 | 1577232 | 1587887 |
| Hospital care | 1724799 | 1756204 | 1770607 | 1768974 | 1789135 | 1791831 | 1798625 | 1810217 | 1820195 |
| Total | 3219048 | 3291958 | 3317920 | 3319722 | 3351013 | 3358270 | 3370997 | 3387448 | 3408082 |
| Integrated model | |||||||||
| Primary care | 1494248 | 1536795 | 1549938 | 1554919 | 1567784 | 1574685 | 1579702 | 1584931 | 1595099 |
| Hospital care | 1724799 | 1691614 | 1647621 | 1589123 | 1548608 | 1498527 | 1507001 | 1508259 | 1524907 |
| Total | 3219048 | 3228409 | 3197559 | 3144042 | 3116392 | 3073212 | 3086703 | 3093190 | 3120006 |
Comparing the 2 organizational models, it can be seen that, in the traditional model, patients began new care episodes each time they changed from one level of care to another.27 This implied a repetition of clinical steps, an increase in waiting lists and, thus, problems with access, continuity, fragmentation, inefficiency and quality.28,29 The deployment of the integrated intervention began in 2013 and consisted of the use of joint care pathways for PC and HC, access to diagnostic tests on the part of PC (nuclear magnetic resonance and densitometry) and consultation with specialists by telephone. Care pathways were agreed upon by PC and HC physicians in order for them to employ homogeneous and coordinated criteria.5,13 An optimal pathway was defined to be followed by patients, depending on their disease, and access to diagnostic tests was facilitated to increase the capacity for solving problems in PC, thus avoiding unjustified referral to specialists at the hospital.14,15 Consultation by telephone was also introduced to expedite communication between different levels of care and save patients from unnecessary travel.16,17 The objective in terms of the use of resources was a reduction in the number of referrals and in the ratio of successive-to-initial visits in specialized care. The use of pathways was also intended to reduce the workload referred to orthopedics, directing patients directly to rheumatology and rehabilitation, without having to go through orthopedics.13 The analysis of the results was based on the consumption of resources and costs.
The objectives were defined utilizing the Delphi technique.30 A group of IHCO clinicians and managers were consulted. They were provided with the referral rates for each disease between 2010 and 2012, and the rates to be achieved in 2020 were established (osteoporosis 7.5%, low back pain 6%, disorders involving the shoulder 13.7% and those involving the knee 11.6%). Moreover, we estimated that the successive/initial ratio could be reduced by a third. The indicators proposed for the evaluation of the integrated program were the number of referrals from PC, the distribution of the referrals per specialty, the number of patient visits per episode for each specialty and the costs.
The information necessary for the study referring to 2012 and 2014 was gathered from administrative and clinical databases of the IHCO, and the unit costs of the consultations (PC and HC) in 2012 were provided by the analytical accounting system. For the projected population between 2012 and 2020, in contrast, we utilized the database of the Basque Statistics Office (EUSTAT). All of the parameters utilized and their sources are available in Table 2 of the online appendix.
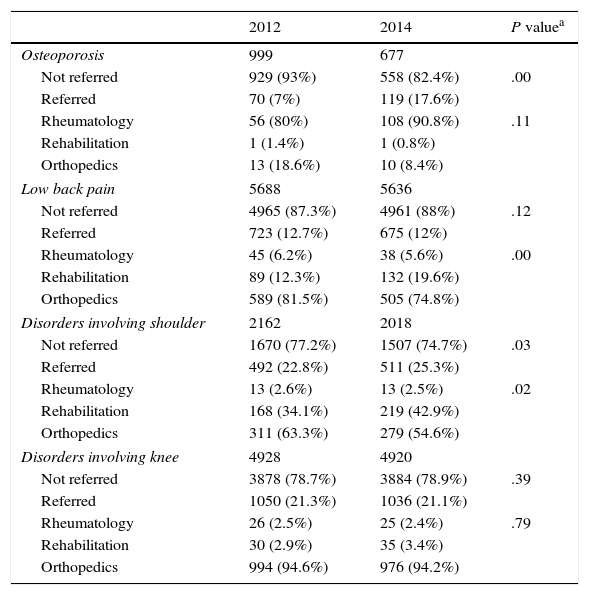
Univariate Statistical Analysis of Referrals From Primary Care to Hospital Care in 2012 and 2014.
| 2012 | 2014 | P valuea | |
|---|---|---|---|
| Osteoporosis | 999 | 677 | |
| Not referred | 929 (93%) | 558 (82.4%) | .00 |
| Referred | 70 (7%) | 119 (17.6%) | |
| Rheumatology | 56 (80%) | 108 (90.8%) | .11 |
| Rehabilitation | 1 (1.4%) | 1 (0.8%) | |
| Orthopedics | 13 (18.6%) | 10 (8.4%) | |
| Low back pain | 5688 | 5636 | |
| Not referred | 4965 (87.3%) | 4961 (88%) | .12 |
| Referred | 723 (12.7%) | 675 (12%) | |
| Rheumatology | 45 (6.2%) | 38 (5.6%) | .00 |
| Rehabilitation | 89 (12.3%) | 132 (19.6%) | |
| Orthopedics | 589 (81.5%) | 505 (74.8%) | |
| Disorders involving shoulder | 2162 | 2018 | |
| Not referred | 1670 (77.2%) | 1507 (74.7%) | .03 |
| Referred | 492 (22.8%) | 511 (25.3%) | |
| Rheumatology | 13 (2.6%) | 13 (2.5%) | .02 |
| Rehabilitation | 168 (34.1%) | 219 (42.9%) | |
| Orthopedics | 311 (63.3%) | 279 (54.6%) | |
| Disorders involving knee | 4928 | 4920 | |
| Not referred | 3878 (78.7%) | 3884 (78.9%) | .39 |
| Referred | 1050 (21.3%) | 1036 (21.1%) | |
| Rheumatology | 26 (2.5%) | 25 (2.4%) | .79 |
| Rehabilitation | 30 (2.9%) | 35 (3.4%) | |
| Orthopedics | 994 (94.6%) | 976 (94.2%) | |
The calculation of the budget impact was based on a discrete event simulation of the flow of patients with musculoskeletal disease and the changes in the consumption of resources and the economic burden from 2012 to 2020.25 According to Mauskopf, the BIA measures the impact of a new treatment on the annual costs, annual health benefit and other outcomes of interest in the years after its introduction into a national health system or a private health plan.23 Discrete event simulation is a flexible modeling method that makes it possible to represent complex behaviors and interactions between different individuals, levels and settings.31,32 The model was built using the Arena® software package from Rockwell Automation. We first obtained the mathematical functions to build the conventional model utilizing the information from 2012. To represent the scenario of the integrated model, we added the objectives that were expected to be achieved estimated by means of the Delphi study.30
To represent the natural history of the patient, each individual who enters the system is assigned personal attributes that will determine the pathway he or she will follow within the model. Unless the patient dies (death from any cause), they will remain in the system until the patient is referred or discharged. Fig. 2 shows the conceptual model with the possible pathways and encounters that the patients can experience. There are 3 difference modes of coming into contact with HC: through PC or the emergency department or the patient's own initiative. Patients who enter by way of PC do so via the office of the general practitioner. In contrast, those who enter through the emergency department or on their own go directly to HC. At both levels of care, patients may need several consultations before being referred or discharged. The simulation model was validated with a goodness-of-fit test. The simulation model is described in detail in the online appendix, and the outcome of the validation employed is shown in Tables 3–8.
Once the model had been validated, we calculated the consumption of resources in each scenario. Multiplying the rates of consumption by the unit costs resulted in the cost of the disease for both the traditional system and the integrated system. Resource use and the costs in each scenario were projected over time from 2012 to 2020, taking into account the effect of population aging.
Statistical AnalysisThe statistical analysis compared the data observed in 2012 and 2014 to see whether resource consumption had changed. The real distance between the results observed in 2014 and the objective was also measured. For the analysis, we utilized all the patient visits corresponding to PC and HC held over a calendar year. Although some consultations corresponded to episodes that had begun in earlier years and others to episodes that continued beyond the end of the year, it was considered that, as all of the consultations were included, these differences would compensate each other. First, a univariate descriptive analysis revealed whether or not there were sociodemographic and clinical differences. In a second step, we analyzed the rates of referral and of resource consumption by group. For this univariate analysis, first, we categorized the rates to therefore apply the chi-square test to see if there were statistically significant differences between the groups. The referral rates were categorized into 2 groups (not referred, referred). Moreover, referred episodes were differentiated in terms of the specialty to which the patient had been sent. To analyze the rates of resource consumption, the episodes were categorized into 3 groups (one consultation, 2–5 consultations or >5 consultations). However, in the results, the means are provided to facilitate interpretation. The last point in the statistical analysis consisted of the univariate evaluation of PC and HC costs per group. The procedure applied was the Mann–Whitney U test.
ResultsDetails concerning the descriptive analysis can be seen in Table 9 of the online appendix. The results showed no significant differences between the sociodemographic and clinical characteristics of the two groups.
The results of the BIA are displayed in Table 1. The changes in the target population of the Goierri-Alto Urola region as a result of population aging can be observed in the first line. An increment in the incidence of 4.4% was foreseen for 2020. We show the possible changes over time of the number of consultations held in PC and HC, together with their associated costs. The costs for the conventional health system increase by 5.9%. In contrast, considering a hypothetical situation in which the intervention proved to be satisfactory within 5 years, it was observed that, in 2020, the budget could be reduced by 8.5%. The annual changes in the costs for each scenario can be seen in Fig. 3A.
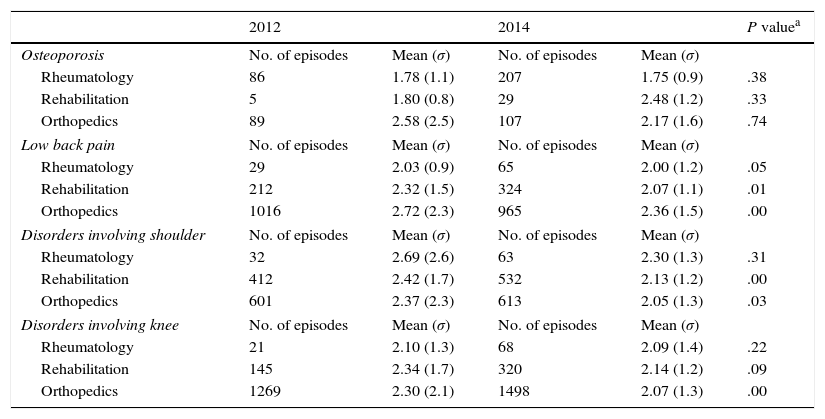
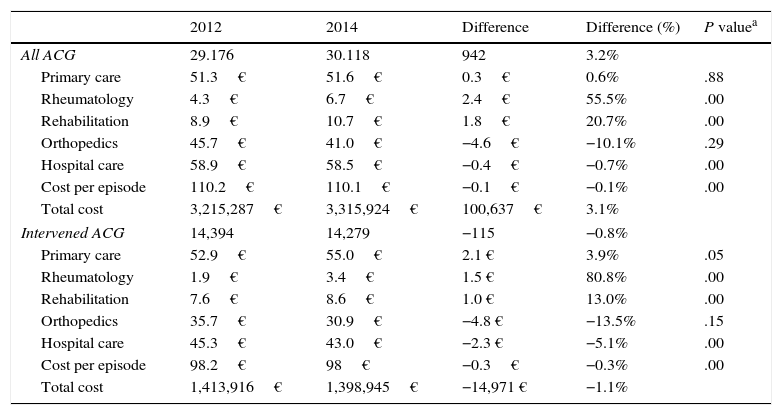
On the other hand, having done the statistical analysis with the evaluation of the 2 periods, we observed no statistically significant improvement in terms of reducing referrals (Table 2). Nevertheless, there actually was a decline in referrals to the orthopedics department. With respect to special care, there was a reduction in the number of consultations per episode in the majority of cases (Table 3). The P values for this table came from the analysis performed with the episodes categorized according to number of patient visits, an outcome that is dealt with in greater detail in Table 10 of the online appendix. The impact of the intervention was also evident in terms of costs (Table 4).
Univariate Statistical Analysis by Disorder and Hospital Specialty of the Number of Consultations per Episode in 2012 and 2014.
| 2012 | 2014 | P valuea | |||
|---|---|---|---|---|---|
| Osteoporosis | No. of episodes | Mean (σ) | No. of episodes | Mean (σ) | |
| Rheumatology | 86 | 1.78 (1.1) | 207 | 1.75 (0.9) | .38 |
| Rehabilitation | 5 | 1.80 (0.8) | 29 | 2.48 (1.2) | .33 |
| Orthopedics | 89 | 2.58 (2.5) | 107 | 2.17 (1.6) | .74 |
| Low back pain | No. of episodes | Mean (σ) | No. of episodes | Mean (σ) | |
| Rheumatology | 29 | 2.03 (0.9) | 65 | 2.00 (1.2) | .05 |
| Rehabilitation | 212 | 2.32 (1.5) | 324 | 2.07 (1.1) | .01 |
| Orthopedics | 1016 | 2.72 (2.3) | 965 | 2.36 (1.5) | .00 |
| Disorders involving shoulder | No. of episodes | Mean (σ) | No. of episodes | Mean (σ) | |
| Rheumatology | 32 | 2.69 (2.6) | 63 | 2.30 (1.3) | .31 |
| Rehabilitation | 412 | 2.42 (1.7) | 532 | 2.13 (1.2) | .00 |
| Orthopedics | 601 | 2.37 (2.3) | 613 | 2.05 (1.3) | .03 |
| Disorders involving knee | No. of episodes | Mean (σ) | No. of episodes | Mean (σ) | |
| Rheumatology | 21 | 2.10 (1.3) | 68 | 2.09 (1.4) | .22 |
| Rehabilitation | 145 | 2.34 (1.7) | 320 | 2.14 (1.2) | .09 |
| Orthopedics | 1269 | 2.30 (2.1) | 1498 | 2.07 (1.3) | .00 |
Univariate Statistical Analysis of Costs Utilizing Unit Costs From 2012.
| 2012 | 2014 | Difference | Difference (%) | P valuea | |
|---|---|---|---|---|---|
| All ACG | 29.176 | 30.118 | 942 | 3.2% | |
| Primary care | 51.3€ | 51.6€ | 0.3€ | 0.6% | .88 |
| Rheumatology | 4.3€ | 6.7€ | 2.4€ | 55.5% | .00 |
| Rehabilitation | 8.9€ | 10.7€ | 1.8€ | 20.7% | .00 |
| Orthopedics | 45.7€ | 41.0€ | −4.6€ | −10.1% | .29 |
| Hospital care | 58.9€ | 58.5€ | −0.4€ | −0.7% | .00 |
| Cost per episode | 110.2€ | 110.1€ | −0.1€ | −0.1% | .00 |
| Total cost | 3,215,287€ | 3,315,924€ | 100,637€ | 3.1% | |
| Intervened ACG | 14,394 | 14,279 | −115 | −0.8% | |
| Primary care | 52.9€ | 55.0€ | 2.1 € | 3.9% | .05 |
| Rheumatology | 1.9€ | 3.4€ | 1.5 € | 80.8% | .00 |
| Rehabilitation | 7.6€ | 8.6€ | 1.0 € | 13.0% | .00 |
| Orthopedics | 35.7€ | 30.9€ | −4.8 € | −13.5% | .15 |
| Hospital care | 45.3€ | 43.0€ | −2.3 € | −5.1% | .00 |
| Cost per episode | 98.2€ | 98€ | −0.3€ | −0.3% | .00 |
| Total cost | 1,413,916€ | 1,398,945€ | −14,971 € | −1.1% | |
As the last point, we compared the situation in 2014 with the objective. Fig. 3B includes the total cost of 2014 at the time of the BIA, as well as possible changes over coming years. It can be seen that the costs of 2014 are slightly separated from the line corresponding to the conventional model. The prediction was that, as the integrated model continued to be developed, the costs would become increasingly farther from the conventional line, getting closer to the objective.
DiscussionGiven the short period of time since the introduction of the integrated program, it is too soon to reach definitive conclusions. Nonetheless, the results of this study enable us to analyze the trend adopted by the intervention, which shows that integration had begun to generate changes in the profile of resource use of the IHCO. Moreover, since the analysis was done for each ACG category, it was possible to begin to evaluate the deployment for each disease and specialty. Thus, the finding of a limited change in the rate of referrals to rheumatology, orthopedics and rehabilitation identified a point that needs to be improved. Even so, the referral rate may have been low before the intervention, meaning that the margin of improvement would be smaller. As a positive aspect, it was seen that there was a significant change in the quality of the referral. There were fewer referrals to orthopedics and part of the workload was referred directly to rheumatology and rehabilitation. This reduced unnecessary consultations and the time that the patient spent in the system. At the hospital level, osteoporosis began to be treated almost entirely by rheumatologists. In contrast, although direct referral of individuals with low back pain to rehabilitation increased significantly, most of those patients, like those with disorders involving the shoulder or the knee, were still sent to the orthopedic department. There was also a decrease in the number of consultations per episode in most cases, and significant changes were observed in the care received by patients with conditions affecting lower back, shoulder and knee. This is due mostly to the fact that these are the disorders in which the work was most intense. Concerning economic aspects, we should point out that the costs associated with orthopedics decreased. Although it was not a statistically significant reduction, it is a fact that should be taken into account, as it is the specialty with the greatest workload. Therefore, the results obtained show that the use of care pathways appropriately directed certain patients to rheumatology and rehabilitation, and that there was a reduction in successive consultations, as well as in the total cost.
Concerning the method utilized, the major contribution of this report was to integrate the BIA into the PDCA cycle to aid in planning the introduction of the integrated model in caring for patients with osteoporosis, low back pain and disorders involving the shoulder and the knee. In terms of management, the simulation made it possible to predict the impact in the budget of an integrated model that achieved the proposed objectives. To the best of our knowledge, this report is the first study in which predictive models were utilized to represent the process of attending to musculoskeletal diseases. The literature provides studies dealing with care pathways introduced into the musculoskeletal area,33,34 but, in no case, were they evaluated by means of simulation models. The use of this tool for the evaluation of health services has also been endorsed by different groups of international experts who, likewise, have stressed that they are seldom utilized.31,35
During the planning stage, the BIA made it possible to extrapolate resource consumption to up to 2020 taking into account population aging in the Goierri-Alto Urola IHCO, for the conventional model as well as for the integrated model. Although the integration intervened in only 4 diseases, showing the overall change in the cost made it possible to visualize that the impact on the musculoskeletal system reached 43.9% of the total cost. We can debate the mode utilized to define the objectives but, for improvements to materialize, it is necessary to establish the goals in quantitative terms. No organization can improve without a clear and firm intention to do so. For that, the consensus achieved using the Delphi technique to define the objectives with respect to referrals and successive consultations helped in the evaluation of the deployment of the integrated model.30 However, we must take into account that the objectives cannot be achieved immediately, rather that attaining them will be gradual.36,37 It was observed that if the objective was achieved progressively over 5 years, there would be cumulative savings that would exceed 1.5 million euros for the period being analyzed.
The combination of the BIA and the statistical analysis enabled us to take into account the variable “time”, giving the study a longitudinal perspective.18 Depending on the moment in which the statistical study was performed, the results, at a given time, could fail to show any statistically significant differences, but the trend of the intervention over time was positive. For that reason, basing the decisions only on the cross-sectional data analysis is associated with the risk of abandoning an intervention that, in the future may be capable of generating important improvements, which become visible on analyzing the trend that the intervention has adopted. As can be seen in Fig. 3B, the point corresponding to 2014 is slightly separated from the line that would be have represented the costs of the conventional model. This showed a change in the trend and suggested that the integrated model was gradually generating the desired impact. In the same image there is also a hypothetical sample of how these points could evolve over the coming years. Even so, to ensure that the predictions are met, it is necessary to take into account the different barriers existing at the time of introducing an intervention involving chronic care.38,39 These barriers can generate resistance to change that makes it difficult to spread the new model and adopt it properly.36,37 Thus, the integrated model implicates carrying out a complex cultural change in which new roles must be adopted. In this respect, the Chronic Care Model identifies 6 areas for improvement when it comes to promoting quality management for chronic diseases.40 The intervention analyzed in this report had an effect mostly on 2 of them: organization of health care and decision support. As a consequence, both the efficiency of the system for musculoskeletal care and the relationship between different levels of care improved. This positive trend will have to be validated in the coming years by consecutive statistical analyses and integrating the results in the BIA. This way, if the points get even closer to those of the line corresponding to the objective, it can be said that we are working in the right direction. Otherwise, it will be necessary to reconsider the deployment and/or the intervention according to an analysis to determine what is failing. After that, we will be able to carry out the required corrective measures and begin the cycle once again.
Ethical DisclosuresProtection of human and animal subjectsThe authors declare that no experiments were performed on humans or animals for this study.
Confidentiality of dataThe authors declare that no patient data appear in this article.
Right to privacy and informed consentThe authors declare that no patient data appear in this article.
FundingThis report was financed by grant no. PI14/01664 from the funds for health research of the Instituto de Salud Carlos III in Madrid, included in the Spanish R&D&I Plan for 2008–2011, and the European Regional Development Fund.
AuthorshipAll of the authors meet the authorship criteria, and there have been no exclusions of anyone else who also meets them. IL, MSG and JaM designed the study. JeM, RSV, MLJ and JA collaborated in the design, provided the conceptual model and collected data. IL, MSG and AA programmed the model and performed the statistical analysis. IL, JaM and MSG wrote the draft of the introduction and discussion. AA and IL wrote the methods and results section. All of the authors reviewed the clinical and epidemiological data, contributed comments concerning the introduction and conclusions, and approved the final text of the article.
Conflict of InterestThe authors declare they have no conflict of interest.
Please cite this article as: Larrañaga I, Soto-Gordoa M, Arrospide A, Jauregi ML, Millas J, San Vicente R, et al. Evaluación de la implementación de un programa integrado de atención a las enfermedades del aparato locomotor. Reumatol Clin. 2017;13:189–196.

