


Juvenile idiopathic arthritis (JIA) has a generalized impact on physical function, thus functional capacity (FC) is one of the main outcome measures in this population. FC can be evaluated using self-referential questionnaires and with observational tests such as the Functional Ability Scale (CAPFUN). The psychometric properties of this scale have not been tested yet.
The objective of this study to evaluate the psychometric properties of the CAPFUN in children with JIA according to Consensus-based Standards for the selection of health Measurements Instruments (COSMIN).
Material and methodsPsychometric properties measurement study. Children were admitted between January 2018 and November 2019. Inclusion criteria: age between 6 and 16 years, diagnosis of JIA, complete physical therapy evaluation, including: CAPFUN scale, Childhood Health Assessment Questionnaire (C-HAQ), Visual Numerical Scale of patient's self-perceived Functional Capacity (VNSFC), Global Rating of Change (GROC) scale and Steinbrocker Scale. Subjects who discontinued follow-up were excluded. The psychometric properties evaluated were: reliability, construct validity, responsiveness, and interpretability.
ResultsA total of 114 children were analyzed. The internal consistency was acceptable, as indicated by a Cronbach alpha of 0.93. Test–retest reliability showed a high level of consistency with an intraclass correlation coefficient of 0.999 (95% CI: 0.998–0.999). Regarding structural validity, the exploratory factor analysis yielded acceptable results, demonstrating the reliability of the instrument. All correlation coefficients were strong and all predetermined hypotheses were verified. The minimal clinically important difference was 0.04. [AUC 0.90 (95% CI: 0.83–0.91)].
ConclusionsThe evaluations of the psychometric properties of the CAPFUN were satisfactory, demonstrating acceptable values for reliability, construct validity, responsiveness, and interpretability. Based on these results, this tool can effectively assess FC in children with JIA, both in clinical practice and research contexts.
La artritis idiopática juvenil (AIJ) tiene un impacto generalizado en la función física; la capacidad funcional (CF) es una de las principales medidas de resultado en esta población. La CF puede evaluarse mediante cuestionarios autorreferenciales y con pruebas observacionales como la escala de Capacidad Funcional (CAPFUN). Algunas propiedades psicométricas de esta escala aún no han sido evaluadas. El objetivo de este estudio fue evaluar las propiedades psicométricas de la CAPFUN en niños con AIJ según los lineamientos recomendados por las guías Consesus-based Standards for the selection of health Measurements Instruments.
Material y métodosEstudio de medición de propiedades psicométricas. Ingresaron niños entre enero de 2018 y noviembre de 2019. Criterios de inclusión: edad entre 6 y 16 años, diagnóstico de AIJ, evaluación completa de fisioterapia, incluyendo: escala CAPFUN, Cuestionario de Evaluación de la Salud Infantil (C-HAQ), Escala Visual Numérica de Capacidad Funcional Autopercibida del Paciente, escala Global Rating of Change y escala de Steinbrocker. Las propiedades psicométricas evaluadas fueron: la confiabilidad, la validez de constructo, la sensibilidad al cambio y la interpretabilidad.
ResultadosSe analizaron 114 niños. La consistencia interna fue aceptable, con un alfa de Cronbach de 0,93. Confiabilidad test-retest: el coeficiente de correlación intraclase resultó de 0,999 (IC al 95%: 0,998-0,999). En cuanto a la validez estructural, el análisis factorial exploratorio arrojó resultados aceptables, demostrando la confiabilidad del instrumento. Todos los coeficientes de correlación fueron fuertes y se verificaron todas las hipótesis. La diferencia mínima clínicamente importante fue de 0,04 (AUC 0,90 [IC 95%: 0,83-0,91]).
ConclusionesLa evaluación de las propiedades psicométricas del CAPFUN fue satisfactoria, presentando valores aceptables de confiabilidad, validez de constructo, sensibilidad al cambio e interpretabilidad.
Juvenile idiopathic arthritis (JIA) is the most common chronic autoimmune disease in childhood causing short- and long-term disability.1 The worldwide incidence of JIA is 0.8–22.6/100,000children/year, with a prevalence of 7–401/100,000 children.2
Because JIA has a generalized impact on physical function, functional capacity (FC) is one of the main outcome measures in this population.3,4 The variable course of this condition requires longitudinal assessments. FC can be measured with self-referential questionnaires and observational tests.5–7 Some of these tools quantify only physical function, while others measure it within an overall construct, such as health status or quality of life.5–10
These instruments can be patient-reported outcome measures (PROMs) self-reported by the patient or a caregiver, or observational tests performed by the investigator. Within PROMs, the Childhood Health Assessment Questionnaire (C-HAQ) is the most widely used to assess functionality in children with JIA.5
In 2006, Iglesias et al. validated a new scale called Functional Ability (CAPFUN, according to the Spanish name) for Argentine children with JIA.11 Unlike self-administered questionnaires, this observational functional scale, performed by physiotherapists, objectively assesses the most affected body segments, activities of daily living with difficulties, and affected joints. It is simple and do not requires special equipment.
Ravelli et al.3 and Bekkering et al.4 had reported differences between observed and self-reported FC in JIA.
Before using a health measurement instrument in scientific research and clinical practice, its psychometric properties should be evaluated. The initiative COSMIN (Consensus-based Standards for the Selection of Health Measurement Instruments)12,13 is a guide for designing or reporting psychometric properties’ studies.14
Iglesias et al. documented the validity of the CAPFUN in Argentine children with JIA. In their study, they evaluated the psychometric properties, focusing on internal consistency and construct validity. However, several psychometric properties of the tool still require assessment.11
We believe a comprehensive assessment of CAPFUN is necessary for its proper implementation.15 Therefore, the objectives of this study were to determine the reliability, construct validity, responsiveness and interpretability of the CAPFUN scale for children with JIA.
Materials and methodsDesignEvaluation study of psychometric properties according to COSMIN guidelines.12,13
ParticipantsChildren aged 6–16 years with a diagnosis of JIA were included, according to the International League of Associations for Rheumatology (ILAR),16 evaluated at the Physical Therapy Unit of Garrahan Hospital between January 1, 2018 and November 1, 2019, who completed the pre-established physiotherapy evaluation protocol including the CAPFUN scale,11 C-HAQ questionnaire,17 the Self-perceived Visual Numerical Scale of Functional Capacity (VNS-FC),18 the Global Rating of Change (GROC) scale,19 the Steinbrocker classification,9 and the measurement of inflammatory activity through the Juvenile Arthritis Disease Activity Score (JADAS10).20 Subjects who were lost to follow-up during the study period were excluded. All received pharmacological treatment and were managed by the physical therapist (PT) according to JIA clinical practice guidelines.21 Data were obtained from review of electronic medical records.
Tools to measure functional capacityThe CAPFUN scale comprises 20 items, divided into 8 upper-limb, 8 lower-limb, 3 combined, and 1 cervical spine activity. Each item is assessed on a scale of 0–2: 0 for impossibility to perform, 1 for incomplete or difficult performance, and 2 for correct performance. The total score ranges from 0 to 2, derived from the average score across all evaluated activities.11
The C-HAQ is a self-administered questionnaire that assesses the degree of self-perceived physical difficulty in performing activities of daily living grouped into 8 domains.17
The Steinbrocker classification evaluates functional deterioration in children with JIA.9
The VNS-FC determines the change in the patient's self-perceived FC, with scores ranging from 0 (no change in FC) to 10 (greatest possible change in FC).18
Psychometric propertiesInternal consistencyInternal consistency was evaluated using Cronbach's alpha coefficient of the CAPFUN scores administered at time zero (T0), the first assessment of the scale. A value in the range of 0.7–0.95 was considered acceptable.22,23
Test–retestFor the test–retest analysis, the cohort consisted of patients who reported no change during the second administration of the tool.24
At time 1 (T1), or the retest, the CAPFUN was administered 10–15 days after T0 to patients who were clinically stable. Clinical stability was determined using the GROC, employing an ordinal scale with three categories. Family members were queried with the question, “How has your child been since the last evaluation: better, the same, or worse?” Patients were categorized as stable if the response was “Same”.19
The intraclass correlation coefficient (ICC) was calculated with its corresponding 95% confidence intervals.19 A 2-way random effects model (ICC 2.1) was used. An ICC≥0.70 was considered acceptable reliability.23
Measurement errorMeasurement error was expressed as the standard error of measurement (SEM)(DE×√1−ICC),24 and as the minimum detectable change (MDC) (SEM×1.96×√2).25
The differences of each measurement between T0 and T1 versus the mean of both measurements were expressed in Bland–Altman plots with the corresponding 95% limits of agreement.26
Structural validityThe internal structure of the scale was analyzed through exploratory factor analysis (EFA), including all variables with a correlation coefficient greater than 0.3 and inter-item correlations no greater than 0.65. A principal component analysis (PCA) was used to explore the relationships between the observed variables (items) and the latent variables (factors) and to identify the structure of the factors. Two methods were used to assess sample adequacy: the Kaiser–Meyer–Olkin (KMO) criterion and Bartlett's test of sphericity. As a rule of interpretation of the KMO indices, values greater than 0.6–0.7 were considered acceptable. Once the assumptions were checked, data extraction was conducted using a PCA with the orthogonal rotation Varimax method. Only those factors with an eigenvalue>1 were considered for the analysis.27
Hypothesis testingCAPFUN scores were correlated with the C-HAQ, the Steinbrocker classification, and the VNS-FC. Pearson's or Spearman's correlation coefficient were used, as appropriate. Correlation coefficients>0.50, between 0.30 and 0.50, and <0.30 were considered strong, moderate, and poor, respectively.22 According to Terwee et al. construct validity is considered acceptable when at least 75% of the predefined hypotheses are confirmed.23 The hypotheses were the following:H1 There is a strong negative correlation between the CAPFUN total score and the C-HAQ. There is a strong negative correlation between the total CAPFUN and Steinbrocker classification scores. There is a strong positive correlation between the CAPFUN total score and the VNS-FC.
To assess whether changes in CAPFUN relate consistently with other criteria, concurrent longitudinal validity was established by correlating score changes between T0 and time 2 (T2) at the 12-month follow-up of the CAPFUN with the C-HAQ, the Steinbrocker classification, and the VNS-FC.28 The hypotheses were the following:H4 There is a strong correlation between CAPFUN and VNS-FC score changes. There is a strong correlation between changes in the CAPFUN and the C-HAQ scores. There is a strong correlation between the CAPFUN and the Steinbrocker classification.
Ceiling and floor effects were presented if more than 15% of the participants achieved the minimum or maximum scores on the questionnaire at T0.23
Minimal clinically important difference (MCID)For the MCID analysis, only patients who were stable or improved at T2 at the 12-month follow-up were considered. Stability or clinical improvement was assessed using the GROC.19
Sample size calculationTo assess reliability, including 100 patients or more is considered “excellent”.23 To evaluate structural validity using a PFA, it is considered adequate a sample ≥100 and at least 5 times the number of items in the tool.12 As the CAPFUN has 20 items, at least 100 subjects must be included.
Statistical analysisCategorical variables are presented as number and percentage. Continuous variables with a normal distribution are reported as mean and standard deviation (SD), while for those with a non-normal distribution median and interquartile range (IQR) are used. The Kolmogorov–Smirnov test was used to determine the sample distribution. The statistical methods used to evaluate the psychometric properties are delineated for each property. A p-value<0.05 was considered significant. IBM SPSS Macintosh software, version 24.0 (IBM Corp., Armonk, NY, USA), was used for data analysis.
Ethical considerationsAll study data were treated with maximum confidentiality in accordance with the National Laws for Personal Data Protection. Given the retrospective nature of the study and because it was considered a low-risk research, informed consent was not required. The protocol was approved by the Ethics and Research Committee of the Garrahan Hospital (#28/01/2021).
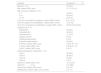
ResultsA total of 149 participants were enrolled, 20 did not meet the inclusion criteria and 15 were excluded due to loss to follow-up. A total of 114 children were included. Of these, 21 (18.4%) did not participate in follow up (T1) assessment and were not included in the longitudinal analysis, but were considered for the remaining psychometric properties. Table 1 describes the demographic and clinical features, functional outcomes, and inflammatory joint activity at admission.
Demographic and clinical features, functional outcomes, and inflammatory joint activity at admission.
| Variables | All patients n=114 |
|---|---|
| Male sex, n (%) | 57 (50%) |
| Age, median (IQR), years | 10.7 (7.9–14.1) |
| Age in years by categories, n (%) | |
| 5–7 | 32 (28.1) |
| 8–12 | 46 (40.4) |
| 13–18 | 36 (31.6) |
| Tiime from 1st symptom to diagnosis, median (IQR), months | 6 (3–12.75) |
| Time from diagnosis to rehabilitation, median (IQR), months | 12 (2–32) |
| Tiime from 1st symptom to rehabilitation, median (IQR), months | 25.50 (10.25–54.50) |
| Diagnosis JIA, n (%) | |
| Oligoarthritis | 23 (20.2) |
| Polyarthritis RF − | 39 (34.2) |
| Polyarthritis RF + | 17 (14.9) |
| Systemic arthritis | 8 (7.0) |
| Undifferentiated arthritis | 4 (3.5) |
| Enthesitis-related arthritis | 23 (20.2) |
| CAPFUN, median (IQR), score | 1.65 (1.37–1.8) |
| C-HAQ, median (IQR), score | 0.62 (0.37–1.5) |
| EVNCF, median (IQR), score | 6 (5–7) |
| Steinbrocker's classification, n (%) | |
| Class I | 23 (20.2) |
| Class II | 38 (33.3) |
| Class III | 49 (43) |
| Class IV | 4 (3.5) |
| JADAS10, median (IQR), score | 14 (4–20.5) |
| JADAS10>1, n (%) | 101 (88.6) |
| Active joints, median (IQR), score | 6 (2–19) |
| Affected joints, median (IQR), score, number | 5 (1–17) |
Abbreviations: n (%): number of patients (percentage); IQR: interquartile range; JIA: Juvenile Idiopathic Arthritis; RF: Rheumatoid Factor; CAPFUN: Functional Ability Scale; C-HAQ: Childhood Health Assessment Questionnaire; VNS-FC: Visual Numerical Scale of Functional Ability; JADAS10: Juvenile Arthritis Disease Activity Score.
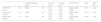
Cronbach's alpha coefficient was acceptable with a value of 0.93. Table 2 shows the coefficients of the total score and by domains of the CAPFUN scale.
Internal consistency and test–retest.
| n | Cronbach's alpha | n | T0 mean (SD) | T1 mean (SD) | ICC (95% CI) | SEM | MDC 95 | |
|---|---|---|---|---|---|---|---|---|
| CAPFUN Scale | 114 | 0.933 | 93 | 1.54 (0.34) | 1.54 (0.34) | 0.999 (0.998–0.999) | 0.011 | 0.03 |
| Lower-limb domain | 114 | 0.932 | 93 | 1.49 (0.45) | 1.49 (0.44) | 0.999 (0.999–1.000) | 0.014 | 0.04 |
| Upper-limb domain | 114 | 0.831 | 93 | 1.59 (0.30) | 1.59 (0.30) | 0.999 (0.998–0.999) | 0.009 | 0.03 |
Abbreviations: SD: standard deviation; SEM: standard error of measurement; ICC: intraclass correlation coefficient; MDC 95%: minimum detectable change; CAPFUN: Functional Ability Scale; C-HAQ: Childhood Health Assessment Questionnaire; VNS-FC: Visual Numerical Scale of Functional Capacity.
Ninety-three (81.6%) participants were considered in this analysis, all were considered stable (GROC: 1). The median number of days between T0 and T1 was 15 (IQR, 13–19). The ICC (2.1) for the CAPFUN was 0.999 (95% CI: 0.998–0.999), a value that was considered acceptable. Table 2 lists the ICC (2.1) for the total score and for each domain of the CAPFUN together with the SEM and MDC.
Measurement errorMeasurement error was presented using the Bland–Altman graph (supplementary material 1) with the corresponding 95% limits, showing uniform dispersion, without funneling effect. Therefore, no systematic change in variability with respect to the score value was identified.
Structural validityAfter analyzing the correlation matrix and individual Kaiser–Meyer–Olkin (KMO) indices, items 1.1, 2.5 and 2.10 of CAPFUN scale were excluded. The overall KMO index was 0.82 with individual indices between 0.54 and 0.91 (item 2.1). Bartlett's test of sphericity was statistically significant (p<0.001).
Four components with eigenvalues greater than 1 were identified, explaining 55.2%, 11.2%, 9.3%, and 6% of the total variance, respectively, together accounting for 81.6% of the variance. The sedimentation graph is shown in Supplementary Material 2.
After excluding factors with loadings below 0.3, it was noted that the conception of FC is perceived through four dimensions (Table 3). Items 1.2, 1.3, 1.10, 2.2, 2.3, 2.6, 2.7, 2.8, and 2.9 behaved as complex variables, sharing factor loadings.
Exploratory factor analysis.
| Item | 1.2 | 1.3 | 1.4 | 1.5 | 1.6 | 1.7 | 1.8 | 1.9 | 1.10 | 2.1 | 2.2 | 2.3 | 2.4 | 2.6 | 2.7 | 2.8 | 2.9 |
|---|---|---|---|---|---|---|---|---|---|---|---|---|---|---|---|---|---|
| Component 1 | 0.49 | 0.51 | 0.70 | 0.78 | 0.87 | 0.89 | 0.90 | 0.85 | 0.70 | 0.42 | 0.68 | 0.45 | 0.42 | ||||
| Component 2 | 0.40 | 0.38 | 0.48 | 0.79 | 0.61 | 0.57 | 0.77 | 0.81 | 0.57 | ||||||||
| Component 3 | 0.65 | 0.61 | 0.32 | 0.92 | 0.53 | ||||||||||||
| Component 4 | 0.34 | 0.84 | 0.342 | 0.35 | 0.52 |
Extraction method: principal component analysis; Varimax rotation method with Kaiser normalization. Rotation converged in six iterations: To improve interpretation, factors with loadings less than 0.3 were removed. The model explained 81.6% of the total variance; component 1 explained=55.2%, component 2=11.2%, component 3=9.3% and component 4=6%.
Spearman's correlation coefficient revealed a strong negative correlation between CAPFUN and C-HAQ scores (−0.98), as well as between CAPFUN scores and the Steinbrocker classification (−0.93). Additionally, a strong positive correlation was observed between the CAPFUN and VNS-FC scores (0.97). All correlation coefficients demonstrated robust strength. All predetermined hypotheses were confirmed (100%). Spearman correlation coefficients are detailed in Table 4.
Hypothesis testing. Spearman's rank correlation coefficient.
| CAPFUN | C-HAQ | Steinbrocker's classification | EVNCF |
|---|---|---|---|
| Index | −0.98 | −0.93 | 0.97 |
| Lower-limb domain | −0.94 | −0.89 | −0.92 |
| Upper-limb domain | −0.90 | −0.86 | −0.88 |
Abbreviations: CAPFUN: Functional Ability Scale; C-HAQ: Childhood Health Assessment Questionnaire; VNS-FC: Visual Numerical Scale of Functional Capacity.
Table 5 shows the differences between T0 and T2. To assess whether changes in the CAPFUN align consistently with other criteria, longitudinal concurrent validity was established by correlating changes in scores between T0 and T2 of the CAPFUN with the C-HAQ score, the Steinbrocker classification, and the VNS-FC score. All correlation coefficients were strong and the predetermined hypotheses were confirmed.
Responsiveness with differences between T0 and T2 of the CAPFUN with the C-HAQ questionnaire, the Steinbrocker Scale, and the EVNCF.
| CAPFUN | Difference C-HAQ | Difference Steinbrocker's classification | Difference EVNCF |
|---|---|---|---|
| Difference CAPFUN index | −0.97 | −0.81 | 0.93 |
| Difference lower-limb domain | −0.75 | −0.63 | 0.68 |
| Difference upper-limb domain | −0.77 | −0.67 | 0.74 |
Abbreviations: CAPFUN: Functional Ability Scale; C-HAQ: Childhood Health Assessment Questionnaire; VNS-FC: Visual Numerical Scale of Functional Capacity.
CAPFUN was administered at T0 to 114 children, with a median total score of 1.65 (IQR, 1.37–1.8). The scores ranged from 0.5 to 2, with three (2.6%) children exhibiting a ceiling effect.
The median score in the lower-limb domain was 1.7 (IQR, 1.29–1.8). The scores ranged from 0.3 to 2, with seven (6.1%) children exhibiting a ceiling effect.
The median score in the upper limb domain was 1.6 (IQR, 1.4–1.82). The scores ranged from 0.7 to 2, with four (3.5%) children exhibiting a ceiling effect.
The floor and ceiling effects were not considered present since fewer than 15% of the participants achieved the minimum or maximum scores on the questionnaire at T0. The scores for each item in the two domains of the CAPFUN are provided in Supplementary Material 3.
Minimal clinically important differenceAccording to the GROC assessed at T2, 21 (18.4%) participants worsened, 33 (28.9%) remained stable, and 60 (52.6%) improved. For the MCID analysis, only subjects who were stable or improved (n=93) at the 12-month follow-up were considered. The MCID was 0.04 [AUC 0.90 (95% CI, 0.83–0.91)], with a sensitivity of 0.90 (95% CI 0.79–0.96), and specificity of 0.91 (95% CI, 0.76–0.98)]. The area under the CAPFUN curve for identifying the MCID at the 12-month follow-up is shown in Supplementary Material 4.
DiscussionFollowing the COSMIN initiative,12,13 the results obtained in this study evaluating the psychometric properties of the CAPFUN scale were satisfactory.
Regarding internal consistency, Cronbach's alpha coefficient was acceptable with a value of 0.93 as reported in the previous validation of the CAPFUN (0.94), demonstrating the reliability of the instrument.11
The values obtained when evaluating test–retest reliability were acceptable (ICC 0.999), indicating that the tool is highly reliable for the assessment of clinically stable patients. Singh et al. in their validation of the C-HAQ obtained an acceptable test–retest reliability, reporting an ICC of 0.79 at two weeks, consistent with the findings in our study.5
Regarding structural validity, the EFA was considered acceptable, demonstrating the reliability of the instrument.11 It is important to emphasize that, unlike the previous validation of the CAPFUN, in our study the EFA is reported as a component of the internal structure. This method is one of the most widely used multidimensional approaches in construction, validation, and adaptation of measurement instruments, as it aids in exploring latent variables or common factors explaining responses to test items.29 In our study, the concept of FC was assessed across four dimensions. Component 1 covered the functionality of all body segments, components 2 and 3 grouped items primarily related to upper-limb activities, together with some lower-limb activities, and component 4 specifically focused on a subset of upper-limb activities.
Hypothesis testing revealed strong Spearman's correlation coefficients across all variables. Strong negative correlations were observed between the CAPFUN and the C-HAQ, as well as with the Steinbrocker classification. In addition, a strong positive correlation was found between the CAPFUN and the VNS-FC. In the study by Iglesias et al.11 the CAPFUN also showed a significant correlation with the C-HAQ and Steinbrocker classification. However, unlike our study, Iglesias et al. reported a wide range of variability within each functional class. Possibly this is due to the sample size (73 versus 114). In our study we correlated the CAPFUN with the VNS-FC, whereas in the validation by Iglesias et al.11 the scale was correlated with active joint count. We consider that such a strong correlation between the CAPFUN and the VNS-FC would provide relevant information in the longitudinal follow-up of this population about self-perceived FC.
Furthermore, in contrast to the earlier validation of the CAPFUN, concurrent longitudinal validity was established by correlating changes in scores between T0 and T2 of the CAPFUN with the C-HAQ, the Steinbrocker classification, and the VNS-FC to assess sensitivity to change, confirming all predetermined hypotheses.
The MCID showed excellent sensitivity and specificity (0.037). An distinctive aspect of this study was the examination of this psychometric property, which was not assessed either by Iglesias et al.11 or by Moroldo et al.17 in the validation and cross-cultural adaptation of the C-HAQ to the Argentine Spanish language. However, Brunner et al.30 reported the MCID of C-HAQ scores of subjects who had minimal significant improvement or worsening between each consultation. The authors reported that the MCID for the C-HAQ was −0.188 for improvement and +0.125 for worsening, values that were close to the MDC in the questionnaire (0.125).
This study has limitations. The analysis of psychometric properties was performed using a retrospective cohort, as complications of the COVID-19 pandemic made prospective follow-up of children with JIA difficult. However, the subjects included in this study were assessed using a pre-established protocol and followed by the same investigator during the sample collection period. In addition, clinical stability was only assessed using the GROC with a three-category ordinal scale and not a Likert scale; however it is the most commonly measurement used in research surveys.
This study has several strengths. Based on our results, the CAPFUN proves to be a valid tool to objectively measure FC in the pediatric population with JIA, through an observational test. To assess FC in this population, questionnaires frequently used are self-administered by parents or children, introducing potential biases related to the level of understanding and/or emotional conditions of the child and their family. This could lead to an underestimation or overestimation of the subject's actual FC. Conversely, the use of observational tests provides valuable information, allowing for a more complete and comprehensive assessment of FC in this complex chronic condition. Conducting this study in a public national reference hospital made it possible to enroll children from different age groups throughout the country.
In future research it would be important to evaluate the usefulness of the CAPFUN scale in the longitudinal follow-up of this population and/or as a primary measurement instrument in new studies.
ConclusionThe evaluations of the psychometric properties of the CAPFUN were satisfactory, demonstrating acceptable values for reliability, construct validity, responsiveness, and interpretability. Based on these results, this tool can effectively assess FC in children with JIA, both in clinical practice and research contexts.
FundingThis research did not receive any specific grant from funding agencies in the public, commercial, or not-for-profit sectors.
Conflict of interestsNone.
The authors acknowledge Soledad Gomez and Julieta Mozzoni for their assistance in this research project.


