


To evaluate the validity, reliability, and performance of the Health Assessment Questionnaire-II (HAQ-II) Spanish version questionnaire to measure physical function.
MethodsA cross-sectional study of 496 patients with rheumatoid arthritis (RA), distributed in 2 samples. The construct validity was evaluated employing the confirmatory factor analysis (CFA) and the validity based on the relationship with other variables. Cronbach's alpha (α) and McDonald’s omega (ω) coefficient were used to determine reliability. Item performance was analysed by fitting different models of item response theory (IRT).
ResultsThe one-factor model presented a poor fit in the CFA; an exploratory factor analysis (AFE) was carried out, which suggested a 2-factor structure. The CFA in the second sample confirmed that the second-order model had a good fit to the data. The general factor explained more than 70% of the variance. The reliability indices showed adequate internal consistency (α = .92–.95; ω = .88–.93). Ninety-three percent of the contrasting hypotheses about the relationship of the HAQ-II scores with other variables were confirmed, demonstrating their convergent, divergent, and known group validity. The multidimensional graduated response model was the one that best predicted person's interaction with the items.
ConclusionThe Spanish version of the HAQ-II presents adequate validity and reliability for measuring Mexican patients' physical function with RA.
Evaluar la validez de constructo, fiabilidad y el funcionamiento de los ítems de una versión en español del Health Assessment Questionnaire-II (HAQ-II) para medir la capacidad funcional.
MétodosEstudio transversal que incluyó 496 pacientes con artritis reumatoide, distribuidos en 2 muestras. La validez de constructo se evaluó mediante el análisis factorial confirmatorio y la validez basada en la relación con otras variables. Para determinar la fiabilidad se empleó el coeficiente alfa de Cronbach (α) y omega de McDonald (ω). El funcionamiento de los ítems se analizó mediante el ajuste a diferentes modelos de la teoría de respuesta al ítem.
ResultadosEl modelo de 1 factor presentó un mal ajuste en el análisis factorial confirmatorio; se realizó un análisis factorial exploratorio que sugirió una estructura de 2 factores. El análisis factorial confirmatorio en la segunda muestra confirmó que el modelo de segundo orden presentó un buen ajuste a los datos. El factor general explicó más del 70% de la varianza. Los índices de fiabilidad mostraron una adecuada consistencia interna (α = .92–.95; ω = .88–.93). El 93% de las hipótesis contrastadas sobre la relación de las puntuaciones del HAQ-II con otras variables se confirmaron, lo cual demuestra su validez convergente, divergente y de grupos conocidos. El modelo de respuesta graduada multidimensional fue el que mejor predijo la interacción de las personas con los ítems.
ConclusiónLa versión en español del HAQ-II presenta una adecuada validez y fiabilidad para la medición de la capacidad funcional en pacientes mexicanos con artritis reumatoide.
Joint inflammation characteristic of rheumatoid arthritis can cause pain and decreased muscle strength, resulting in impairment of the person's functional capacity. Functional capacity can be measured using an instrument (questionnaires) or by direct observation with tests of performance of a specific task associated with function (performance-based tests)1 and is a relevant outcome in the management and follow-up of patients with rheumatoid arthritis.2,3
Functional capacity in people with rheumatoid arthritis is usually assessed using self-completed questionnaires, that look at the patients' perception of their physical abilities and the difficulty they have in performing activities of daily living. The patient’s perception of their functional limitation predicts physical disability, the need for joint replacement, the likelihood of loss of employment and premature death.2,4
The Health Assessment Questionnaire-Disability Index (HAQ-DI), the Health Assessment Questionnaire-II (HAQ-II) and the Multi-Dimensional Health Assessment Questionnaire (MDHAQ) are among the most used questionaires.5 The HAQ-DI questionnaire is considered the gold standard for assessing functional limitation.6,7 However, the length of the HAQ-DI limits its routine use, and it has also been shown to have certain drawbacks in its psychometric properties: presence of a floor effect, lack of linearity and possible misinterpretation of some items.4,8
The HAQ-II was developed to improve the psychometric properties of the HAQ-DI by employing methods based on item response theory (IRT).4 The American College of Rheumatology recently recommended the HAQ-II for the assessment of physical functioning in daily clinical practice.5 Studies have demonstrated the validity of the English,4,9 Dutch10 and Spanish11 versions of the HAQ-II.
It is well known that for reasons of cultural diversity there are differences between European Spanish, American Spanish and different variants of American Spanish.12 These differences can lead to misinterpretation or misunderstanding of an expression, especially when there are also many phonetic, morphosyntactic and lexical differences.12 There are 2 versions in Spanish of the HAQ-II developed for use in Argentina and the United States (USA).11,13 Waimann et al.11 reported adequate reliability and convergent validity for the Spanish version of this tool for use in Argentina. After the literature review, no study was found that reported the psychometric properties of the US Spanish version, but this version was considered the most suitable for use in the Mexican population for the following reasons: 1) speakers of Mexican origin represent almost 2/3 (63%) of US Spanish speakers;14 2) because Hispanic people of different origins live together in the USA, when translating an instrument, the use of "neutral Spanish" or "international Spanish" is considered; i.e., a linguistic version is developed that is appropriate for more than one country;15,16 3) previous studies have demonstrated the validity of the US Spanish version of the Patient Activity Scale-II (PAS-II) and the Medical Outcome Study Pain Severity Scale in the assessment of Mexican patients with rheumatoid arthritis;3,17,18 and 4) the translation was carried out by the group of authors who developed the original English version.
Cross-cultural adaptation of instruments is useful when there is evidence of adequate psychometric properties in other populations and it seeks to ensure that the instrument has the same psychometric properties as the original to guarantee comparability of results.3 In other words, the use and interpretation of the results are validated and not the instrument per se. There is no study to date that has evaluated the psychometric properties of a Spanish version of the HAQ-II in the Mexican population. The aims of the study are 1) to assess construct validity; 2) to assess reliability; and 3) to analyse the behaviour and functioning of the HAQ-II items.
Material and methodsA cross-sectional study design to validate a questionnaire. The study sample included patients with rheumatoid arthritis seen in the rheumatology outpatient clinic of 2 second-level care hospitals in central and south-eastern Mexico, selected by consecutive case sampling. The patients were divided into 2 samples: 1) patients assessed from March 2018 to February 2020 and 2) patients assessed from March to September 2016. The exploratory factor analysis (EFA) was performed in one sample and the confirmatory factor analysis (CFA) in the other. The inclusion criteria were meeting the ACR/EULAR classification criteria for AR19 and age ≥ 16 years. Patients who could not read and those who did not wish to complete the questionnaires were excluded. The study complied with the ethical standards of the Declaration of Helsinki and was approved by the ethics committee of the Mexican Social Security Institute. Informed consent was obtained from all study participants.
The sample size was calculated based on the recommendations of experts in the subject. For factor analysis, the sample size should be at least 7 times the number of items (i.e., 70 patients) with a minimum of 100.20 Regarding sample size for IRT analysis, current guidelines indicate that a sample of ≥500 patients is adequate for logistic models of 2 parameters.20
The participants completed a series of questionnaires in paper format: the HAQ-II13, HAQ-DI15, Rheumatoid Arthritis Quality of Life Scale RAQoL),21 Hospital Anxiety and Depression Scale (HAD)22 and the MOS pain severity scale (MOS-PSS).17 If required, the same physician clarified any doubts in this regard. After completion of the questionnaires, each patient was clinically assessed by the same rheumatologist and the degree of disease activity was calculated based on the Clinical Disease Activity Index (CDAI)3 and the Disease Activity Score 28 (DAS28).3 Unlike the patients in the first sample, the patients in the second sample did not have RAQoL, HAQ-DI and DAS28 results.
InstrumentThe HAQ-II comprises 10 items with a 4-category response scale. The score is obtained from the mean of the items and requires at least 8 items to be answered. Scores range from 0 to 3, where a higher score indicates a greater degree of functional limitation. The US Spanish translation, obtained from the website of the National Data Bank of Rheumatic Diseases,13 was used in this study. This version contains simple language and vocabulary commonly used in our population. A pilot test prior to use in sample 2 (n = 30) demonstrated that it was adequately understood. Most patients understood and responded without difficulty. However, minor changes were made from the original. In 2 questions, terms were added to clarify the meaning of the words: In the item "Sitting on and getting up from the “inodoro” (toilet)" the clarification "(retrete, taza del baño (toilet))" was added and in the item "Opening the doors of an “auto” (car)" the clarification "(coche (car))" was added: these are terms commonly used in our population. On the other hand, in the item "Reach and lower an object weighing 2 kg. Like 2 bags of sugar from a height above your head" the wording was changed to "Reach and lower a 2 kg object, like a bag of sugar, from a height above your head", since in our population sugar is commonly bought in 2 kg. The HAQ-II instrument and the description of the other instruments used in this study can be found in the supplementary material.
Assessment of construct validityConstruct validity assesses the degree to which the instrument reflects the theory of the construct to be measured (functional ability); it provides evidence of whether the way the scores are interpreted is correct according to the theory and constructs being measured.23 To demonstrate the construct validity of the HAQ-II, validity based on internal structure and validity based on the relationship with other variables were analysed.
Validity based on internal structureInternal structure analysis assesses whether the items match the dimensionality described when developing the instrument, i.e., whether the internal structure of the instrument remains unchanged. Factor analysis is a statistical technique that enables assessment of the internal structure of an instrument, to define the number of factors and which items are grouped in each factor. With factor analysis it can be shown whether the empirical evidence allows the model to be accepted based on the theory about the construct being assessed or whether it should be rejected and a new model to explain the measured construct be proposed. There are 2 types: the EFA and the CFA. The EFA, based on the data, explores the possible constructs that explain the responses to the items of an instrument. Once the number of factors has been obtained, depending on the content of the items included in each factor, the name of the construct obtained is subsequently defined. On the other hand, the CFA requires a theory to explain the responses to the items and to establish the specifications of the model, i.e., the construction of the model is based on a priori information. The CFA tests whether the factor structure is consistent (a good fit to the data) with the theoretical structure and is used to demonstrate the construct validity of the models obtained in the EFA.24
The procedure for evaluating the internal structure of the HAQ-II required 3 stages: 1) the first sample (n = 343) used the CFA, evaluating the one-factor model described in the original English version;4 2) given that the Spanish version showed a poor fit to the one-factor model, the possibility of a new model based on the EFA was analysed and 3) the second sample (n = 153) was used to validate the model obtained in the EFA. Two models were evaluated with the CFA: 1) 2-factor correlated model; 2) 2-factor first-order model and one second-order factor.
Validity based on the relationship with other variablesRelationships with other variables measuring the same construct (convergent validity) or different constructs (divergent validity) are relevant when the instrument scores are used to estimate the patients' level on a construct, as they provide information on the extent to which these relationships are in accordance with the construct on which the interpretation of the results is based. Correlation between instruments measuring the same construct is expected to be higher than between instruments measuring different constructs. Known-group validity is demonstrated when instrument scores discriminate between groups of patients who are theoretically expected to be different in the construct measured.
The following hypotheses were tested to assess convergent validity:
- 1
The correlation between the HAQ-II and the HAQ-DI15 should be high (ρ ≥ .7), as they assess the same construct.
- 2
Because they are constructs that are related but conceptually different, the HAQ-II score should have a moderate or higher correlation (ρ ≥ .5) with severity of pain (measured with the MOS-PSS questionnaire17), fatigue (measured on a visual analogue scale from 0 to 10), overall assessment of the patient (measured on a visual analogue scale from 0 to 10), disease activity (measured with the CDAI and DAS283) and quality of life (measured with the RAQoL questionnaire21).
The following hypothesis was tested to assess divergent validity:
- 1
The HAQ-II will present a low correlation (.3 > ρ < .49)4 with the score of the anxiety and depression subscales of the HAD, as they are different constructs.
The following hypothesis was tested to assess the validity of known groups:
- 1
Patients with moderate to severe disease activity based on CDAI score (CDAI > 10) will present a significantly higher HAQ-II score than the patients in clinical remission and with low disease activity (CDAI ≤ 10).
To demonstrate the evidence of construct validity it was considered necessary to confirm 75% of the a priori hypotheses.25
Evaluation of reliabilityReliability assesses the precision with which an instrument measures a construct; i.e., it provides error-free measurements.23 Internal consistency measures the homogeneity of the items of an instrument by indicating the relationship between them and is the most used method to measure the reliability of an instrument. Within IRT analysis, the marginal reliability coefficient provides an estimate of how accurately an instrument measures. The marginal reliability coefficient is interpreted as the proportion of variance in the observed score that is due to the true score.26
Analysis based on the item response theoryThe IRT groups a series of models that, using mathematical functions, describe the probability of a patient selecting a given response to an item according to his or her latent trait (functional ability). The IRT allows for invariant measurements beyond the items that make up the instrument and provides information on the accuracy with which the construct is measured as a function of latent trait level (θ). In the IRT, the item is considered the unit of analysis and the patient’s latent trait level is estimated from the response pattern obtained from the set of items.27 The number of latent traits involved when answering an item establishes whether the model is unidimensional (one latent trait) or multidimensional (more than one latent trait). IRT models link the patient’s θ level item parameters with the parameters of the item (discrimination and difficulty) and the probability of selecting a response. The discrimination parameter (α) measures the strength of the relationship between the item and the latent trait being measured.28 Difficulty parameters (β parameters) are interpreted as standard deviations that show the range of the latent trait covered by the item. The higher the β parameter, the greater the level of functional limitation a person must have to select that response option.28 Goodness-of-fit tests allow an assessment of the extent to which the model represents the observed data.27 If the model fits the empirical data, it can be assumed that the model appropriately represents the relationship between the latent trait and the probability that the patient will select a particular response to the item.
Statistical analysisThe descriptive analysis of the categorical variables (characteristics of the patients and items) and the floor-ceiling effect (patients scoring the lowest and highest possible score, respectively) are presented as the number of cases (n) and their percentage (%). For continuous variables they are presented as mean and standard deviation (mean ± SD) or median (interquartile range), as appropriate. The t-test for related samples was used to compare between the scores of factor 1 and factor 2. Concordance between HAQ-DI and HAQ-II was assessed with Lin’s concordance correlation coefficient (CCC) and by the Bland-Altman method.29
Factor analysis. The CFA was performed using polychoric correlations and the diagonally weighted least squares (DWLS) method was used as the procedure for estimating the parameters.30 The criteria used to determine good model fit were a chi-square ratio (χ2) over degrees of freedom (CMIN/DF) <3, root mean square error of approximation (RMSEA) <.06, standardised root mean square residual (SRMR) ≤ .08, comparative fit index (CFI) ≥ .95 and Tucker Lewis index (TLI) ≥ .95. An RMSEA value ≤ .08 is considered an acceptable fit and a value> .10 is considered a poor fit.18 In the EFA, the appropriate number of factors to extract was determined with parallel analysis, parameters were estimated with the minimum residuals method (minres) and an oblimin rotation was used.
Validity based on the relationship with other variables. Spearman's correlation coefficient (ρ) was calculated between the HAQ-II scores and the scores of the other instruments. Kruskal–Wallis test and Dunn’s test were used to determine between which groups the HAQ-II scores differed significantly according to the degree of disease activity as measured by the CDAI.31
Reliability. Internal consistency was estimated with Cronbach’s α and McDonald’s ω. These coefficients are interpreted in the same way: a value between .70 and .95 is considered appropriate.32
IRT-based analysis. The IRT models evaluated were the partial credit model (PCM), the unidimensional generalised partial credit model (GPCM) and multidimensional generalised partial credit model (MGPCM), unidimensional graded response model (GRM) and multidimensional graded response model (MGRM). The fit of the model to the data at item level was assessed with the S-X2 statistic, a Benjamini-Hochberg-adjusted p-value <.05 indicated poor fit at item level.18 An overall good model fit was considered if the p-value of the limited information statistic (M2*) was >.05, RMSEA < .089 and SRMR <.05.18 The G2-LD and Q3 indices were used to evaluate the assumption of local independence of the items.30 The results of the models were compared using the goodness-of-fit indices, the likelihood ratio test and Vuong’s test.33 The Zh statistic was used to assess person fit.34 The Zh statistic is used to identify individuals whose response to the items is not consistent with their latent trait level. A Zh value higher than ±2 reflects people with an “atypical” or “inconsistent” response pattern.34
R software (R Core Team, 2017, Vienna, Austria) was used for the statistical analysis. The packages used for the data analysis were psych for descriptive analysis and EFA; lavaan and semplot for the CFA; psych and semtools for the reliability analysis and mirt to calibrate the IRT models.
ResultsGeneral characteristics of the participantsFive hundred and eight patients met the inclusion criteria, of whom 496 (97.63%) completed all the items of the HAQ-II. Participants with incomplete items were eliminated; most left one item unanswered; only one patient did not answer 3 items. The items with the highest number of missing values were item 6 (n = 2) and 10 (n = 2). The total sample (n = 496) mainly comprised females (87.5%), with a mean age of 49.8 years (range: 16–79) and a mean of 9 years’ education (Table 1). The HAQ-DI showed a higher frequency of the floor effect (11.1%; 38 out of 343) than the HAQ-II (8.2%; 28/343). Neither the HAQ-II nor the HAQ-DI had a ceiling effect.
General characteristics of the study participants.
| Sample 1 (n = 343) | Sample 2 (n = 153) | Total (n = 496) | |
|---|---|---|---|
| Age | 49.28 ± 11.50 | 51.01 ± 11.63 | 49.81 ± 11.56 |
| Education | 9.77 ± 4.13 | 7.9 ± 3.57 | 9.22 ± 4.06 |
| Health Assessment Questionnaire-II (one-factor model) | .8 (1) | .8 (.9) | .8 (.9) |
| Health Assessment Questionnaire-II (2-factor model) | |||
| Factor 1 | .6 (1) | .6 (.8) | .6 (1) |
| Factor 2 | .8 (1.2) | .8 (1) | .8 (1.2) |
| Total | .8 (1) | .8 (.9) | .8 (.9) |
| Health Assessment Questionnaire-II (2 factors, theta value, θ) | |||
| Factor 1 | .01 ± .95 | −.10 ± .96 | −.01 ± .94 |
| Factor 2 | .02±.93 | −.08 ± -.10 | −.01 ± .95 |
| Health Assessment Questionnaire-Disability Index (HAQ-DI) | 1 (1.12) | – | – |
| Clinical Disease Activity Index (CDAI) | 8 (15.5) | 6.25 (12.5) | 7 (14.5) |
| Disease Activity Score 28 (DAS28) | 3.61 ± 1.45 | – | – |
| Rheumatoid Arthritis Quality of Life Scale (RAQoL) | 10 (14) | – | – |
| MOS pain severity scale (MOS-PSS) | 51.42 (40) | 54.28 (28.57) | 54.28 (38.57) |
| Visual analogue fatigue scale | 3.5 (5.5) | 3.2 (5.5) | 3.5 (5.5) |
| Visual analogue scale for overall patient assessment | 3.5 (5.5) | 3 (5) | 3 (5.5) |
| Hospital anxiety and depression scale | |||
| Anxiety | 7 (5) | 9 (7) | 7 (5) |
| Depression | 6 (5) | 8 (5) | 6 (5) |
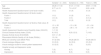
The results of calibration of the items in the first sample are shown in Table 2. The results of the CFA showed a poor fit to the one-factor model (RMSEA > .10), and therefore an EFA was performed on the data, which showed that a 2-factor correlated model explains the responses to the items of HAQ-II. The CFA in the second sample showed that the 2-factor correlated model and the second-order model showed an acceptable fit to the data (RMSEA = .08; SRMR = .06). Respecification of the model, including the correlation between the residuals of items 8 and 9, resulted in a good fit of the model to the data (Fig. 1).
Results of the confirmatory factor analysis and the exploratory factor analysis in the patients of sample 1.
| Health Assessment Questionnaire-II (HAQ-II) | International Classification of Functioning (ICF) | AFC One-factor model | AFE 2-factor model | |||||
|---|---|---|---|---|---|---|---|---|
| Factorial load (standard error) | R2 | Factorial load | ||||||
| Item | Description | ICF component | ICF code | ICF Category | Factor 1 | Factor 2 | ||
| 1 | Getting up from a chair without using your arms | Mobility | D4103 | Changing basic body position/sitting | .82 (.00) | .68 | .98 | .12 |
| 2 | Walking outside the home, on level ground | Mobility | D450 | Walking | .80 (.04) | .64 | .66 | .16 |
| 3 | Sitting and getting up from the toilet “inodoro” (“retrete, taza del baño”) | Mobility | D4103 | Changing basic body position/sitting | .86 (.03) | .74 | .86 | .04 |
| 4 | Reaching and lowering a 2 kg object, such as a bag of sugar, from a height above your head | Mobility | D4452 | Using the hands and arms/reaching | .82 (.03) | .68 | .32 | .54 |
| 5 | Opening the doors of a car “auto” (“coche”) | Mobility | D4450 | Hand and arm use/pulling | .81 (.03) | .66 | .38 | .43 |
| 6 | Cleaning a patio | Domestic life | D640 | Doing housework | .85 (.03) | .73 | .44 | .47 |
| 7 | Standing in a queue for 15 minutes | Mobility | D4154 | Maintaining a body position/staying in a standing position | .84 (.03) | .71 | .47 | .42 |
| 8 | Moving heavy objects | Mobility | D449 | Carrying, moving, and handling objects | .97 (.03) | .94 | .01 | .99 |
| 9 | Holding heavy objects | Mobility | D440 | Fine hand use/catching | .96 (.03) | .92 | .02 | .99 |
| 10 | Climbing stairs quickly | Mobility | D455 | Walking and moving | .81 (.03) | .66 | .58 | .24 |
| [0,1−5]Average variance extracted (AVE). The variance of the construct can be explained through the items | .74 | – | [.8−9]- | |||||
| [4,0]Goodness-of-fit statistics of the CFA models | [0,2−5] χ2 ratio over degrees of freedom (CMIN/ DF) | [.6−7]5.85 | [.8−9]- | |||||
| [0,2−5]Root mean square error of approximation (RMSEA) (90% confidence interval) | [.6−7].11 (.10−.13) | [.8−9].05 (.01−.09) | ||||||
| [0,2−5]Comparative fit index (CFI) | [.6−7].99 | [.8−9]- | ||||||
| [0,2−5]Tucker-Lewis index (TLI) | [.6−7].99 | [.8−9].99 | ||||||
| [0,2−5]Standardised root mean square residual (SRMR) | [.6−7].06 | [.8−9].02 | ||||||
| [1,0]Reliability coefficients | [0,2−5] Cronbach’s α | [.6−7].96 | .93 | .95 | ||||
| [0,2−5]MacDonald’s ω | [.6−7].94 | .89 | .93 | |||||
CFA: confirmatory factor analysis; EFA: exploratory factor analysis.

Ninety-three percent of the tested hypotheses on the relationship of HAQ scores to other variables were confirmed, demonstrating convergent, divergent, and known-group validity. The total HAQ-II score was calculated as the mean of factor 1 and factor 2. The correlation coefficients of the HAQ-II scores with other variables are presented in Table 3.
Correlation between the Health Assessment Questionnaire-II y Health Assessment Questionnaire-Disability Index scores with other clinical variables.
| HAQ-DI | Disease activity (CDAI) | Disease activity(DAS28) | Quality of life (RAQoL) | Pain (MOS-PSS) | Fatigue (VAS) | Patient assessment (VAS) | Anxiety (HAD) | Depression (HAD) | |
|---|---|---|---|---|---|---|---|---|---|
| HAQ-II (one factor) | .87 (.84−.89) | .56 (.49−.62) | .51 (.41−.60) | .72 (.66−.77) | .64 (.57−.71) | .68 (.62−.73) | .65 (.59−.71) | .33 (.22−.43) | .40 (.29−.49) |
| Factor 1 | .81 (.77−.84) | .52 (.45−.58) | .48 (.37−.57) | .65 (.58−.71) | .61 (.54−.67) | .68 (.58−.70) | .62 (.55−.68) | .30 (.19−.40) | .35 (.25−.45) |
| Factor 2 | .84 (.80−.87) | .54 (.47−.60) | .48 (.37−.57) | .70 (.64−.75) | .59 (.52−.66) | .63 (.56−.69) | .62 (.55−.68) | .32 (.21−.42) | .40 (.29−.49) |
| Summary (Average of factor 1 and 2) | .87 (.85−.89) | .56 (.49−.62) | .51 (.41−.60) | .72 (.66−.77) | .64 (.57−.69) | .68 (.62−.73) | .65 (.59−.71) | .33 (.22−.43) | .40 (.30−.49) |
| Factor 1 | .85 (.82−.87) | .55 (.48−.61) | .47 (.36−.56) | .70 (.63−.75) | .64 (.57−.69) | .64 (.57−.70) | .62 (.55−.68) | .32 (.21−.42) | .38 (.28−.47) |
| Factor 2 | .84 (.80−.86) | .52 (.44−.60) | .51 (.41−.60) | .70 (.64−.75) | .60 (.52−.66) | .67 (.61−.73) | .65 (.58−.71) | .31 (.20−.41) | .40 (.30−.50) |
| HAQ-DI | 1 | .55 (.47−.62) | .52 (.42−.61) | .73 (.67−.78) | .66 (.59−.72) | .64 (.58−.70) | .61 (.54−.67) | .34 (.22−.44) | .41 (.30−.50) |
n = 343. Spearman’s correlation (95% confidence Interval).
CDAI: Clinical Disease Activity Index; DAS28: Disease Activity Score 28; HAD: hospital anxiety and depression scale; MOS-PSS: MOS pain severity scale; RAQoL: Rheumatoid Arthritis Quality of Life Scale; VAS: visual analogue scale.
The HAQ-II score was able to differentiate patients with inflammatory activity from patients with remission/low disease activity. The HAQ-II score was significantly higher according to the disease activity level measured by the CDAI (p < .001). Except for the comparison of moderate versus severe disease activity groups, all comparisons were significant (p < .005) in the post hoc analysis.
ReliabilityThe Cronbach α coefficient (range from .92 to .95) and McDonald’s ω (range from .88 to .93) results showed appropriate internal consistency (Table 2 and Fig. 1). The marginal reliability coefficient for factor 1 and factor 2 was .89 and .92, respectively, which demonstrates that accurate measurements are achieved according to this IRT indicator.
Item response theory modelsThe IRT-based analysis was performed with the total patient sample (n = 496) to obtain the highest accuracy of the estimated parameters. The results of the fit for the evaluated models are shown in Table 4. The 2-factor correlated multidimensional graduated response model (MGRM) showed the best fit to the data and was significantly better than the MGPCM (p = .03). A couple of items (items 8 and 9) showed a poor fit based on the established standards. However, removing either of these items caused an overall poor fit of the model. None of the items showed local independence.
Results of the fit of item response theory (IRT) models to the HAQ-II and comparison of their goodness-of-fit.
| Models | M2* (p value) | RMSEA (95% CI) | SRMR | TLI | AIC |
|---|---|---|---|---|---|
| Unidimensional | |||||
| Partial credit model (MCP; Rasch) | <.001 | .12 (.10−.13) | .06 | .95 | 8261.62 |
| Generalised partial credit model (GPCM) | <.001 | .09 (.07−.11) | .05 | .97 | 8229.71 |
| Graduated response model (GRM) | <.001 | .10 (.08−.12) | .05 | .96 | 8209.71 |
| Multidimensional | |||||
| Multidimenstional generalised partial credit model (MGPCM) | .005 | .04 (.02−.07) | .05 | .99 | 8093.53 |
| Multidimensional graduated response model (MGRM) | .14 | .02 (.01−.05) | .05 | .99 | 8069.96 |
Comparison of models:
GPCM compared with the MGPCM: LR Test p < .001, Vough’s test p < .001.
GRM compared with the MGRM: LR Test p < .001, Vough’s test p < .001.
MGPCM compared with the MGRM: LR Test p < .001, Vough’s test p = .03.
AIC: Akaike information criterion; 95% CI: 95% confidence interval; RMSEA: root mean square error of approximation; SRMR: standardised root mean square residual; TLI: Tucker-Lewis Index.
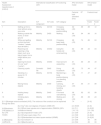
Item parameters. The estimations for the parameters and the statistics of fit for each item are shown in Table 5. The range of discrimination parameters was 2.21–7.36, which indicates that the items discriminate well between individuals with high and low functional ability. The item with the highest ability to distinguish between patients was item 8 “Moving heavy objects”. By contrast, item 5 “opening car doors” showed the least discrimination. All the difficulty parameters (β) of the items were in increasing order, which indicates that a higher functional limitation score is necessary as one increases in the selected response category. The items “walking outside one’s home” and “opening car doors” were the “most difficult” items, i.e., they required a high level of functional limitation to be selected. By contrast, the items “moving heavy objects” and “holding heavy objects” were the “easiest” terms, in other words, patients need mild functional limitation to select them, indicating that these items are where people most frequently showed their functional limitation.
Parameters estimated with the MGRM multidimensional graduated response model (MRGM), fit of the items and marginal reliability coefficient of the IRT.
| Discrimination A (MDISC) | Difficulty (MDIFF) | Fit to the level of the item | Marginal reliability coefficient | ||||
|---|---|---|---|---|---|---|---|
| Item | Description | B1 | B2 | B3 | S-χ2 (p) | ||
| Dimension (factor) 1 | |||||||
| 1 | Getting up from a seat without using your arms | 2.74 | .008 | 1.411 | 2.264 | .38 | .89 |
| 2 | Walking outside the home, on level ground | 2.83 | .299 | 1.557 | 2.649 | .38 | |
| 3 | Sitting and getting up from the toilet “inodoro” (“retrete”, “taza del baño”) | 3.56 | .107 | 1.329 | 2.478 | .11 | |
| 7 | Standing in a queue for 15 minutes | 3.01 | −.503 | .745 | 1.667 | .38 | |
| 10 | Climbing stairs quickly | 2.92 | −.612 | .596 | 1.392 | .89 | |
| Dimension (factor) 2 | |||||||
| 4 | Reaching and lowering a 2 kg object, such as a bag of sugar, from a height above your head | 2.55 | −.400 | .927 | 1.771 | .54 | .92 |
| 5 | Opening the doors of a car “auto” (“coche”) | 2.21 | .267 | 1.624 | 2.568 | .38 | |
| 6 | Cleaning a patio | 2.91 | −.336 | 1.003 | 1.955 | .48 | |
| 8 | Moving heavy objects | 7.36 | −1.080 | .274 | .906 | .005 | |
| 9 | Holding heavy objects | 6.37 | −1.025 | .257 | .887 | .005 | |
Data obtained from analysis of the total sample (n = 496).
Parameter A represents the multidimensional discrimination parameter (MDISC).
The B parameters represent the multidimensional difficulty (MDIFF). High positive B values indicate difficult items (i.e., items that require high values of functional limitation to produce a probability of a correct response greater than .5). Low and more negative B values indicate items with a high probability of correct response for individuals with low levels of functional limitation.
Overall fit of the model to the data: M2*; p = .14; RMSEA .02 (95% CI: 0–.05); SRMR = .05; TLI = .99.
Person parameters. The estimations of functional capacity (θ) of the patients in the first factor were distributed in logit values of −1.67 and 2.73; and between −1.76 and 2.58 in the second factor. Analysis of the fit of the individuals showed that 95.37% of the response patterns fitted the model (Zh statistic value between −2 and 2), and only 1.61% of the individuals presented an “atypical” or “inconsistent” response pattern, with a Zh statistic value <−3.
Interpretation of resultsThe correlation between the scores obtained through averaging the means and the θ value obtained in the MGRM was .95 (95%CI: .95–.96) for factor 1 and .96 (95%CI: .95–.97) for factor 2. The average score of the items of factor 2 was significantly higher than that of factor 1 in sample 1 (4.09 compared to 3.03; p < .001) and in sample 2 (3.78 compared to 2.74; p < .001). The magnitude and direction of the correlation between the HAQII and the HAQ-DI with the clinical variables studied were similar (Table 5). Concordance between the HAQ-II and the HAQ-DI showed a CCC = .87 (95%CI: .84−.89) and bias estimated using the Bland-Altman method was .04 (concordance limits: −.62, .72).
DiscussionThe study results show that the internal structure of the Spanish version of the HAQ-II comprises 2 factors. The 2-factor correlated models and the second order model had equivalent levels of fit. However, the high correlation between 2 factors obtained in the CFA indicates the presence of a general factor. The second order model provides a reasonable explanation of the correlations between the first order factors.35 The study results show that the HAQ-II comprises a general factor that indirectly measures functional ability (through the items) and 2 related but distinct factors that measure specific characteristics of functional ability.
Analysis of the factor structure affects the interpretation of an instrument’s score and may reveal that the score needs to be broken down into several scores. Three scores can be obtained from the second order model, one for each factor and a total score. Because the overall factor (functional ability) explains most of the observed variance in item response (>.7), the HAQ-II can be considered essentially a unidimensional instrument.36 In clinical practice, the total score may be the most useful.
Based on the analysis of the content of the items (Table 2) included in each of the factors, from the international classification of functioning (ICF),37 factor 1 was considered to measure "activities with predominant functioning of the lower limbs" and factor 2 to measure "activities with predominant functioning of the upper limbs". Because rheumatoid arthritis predominantly affects the small and medium-sized joints of the upper limbs, there is a theoretical justification that functional limitation in patients with this disease would be greater in the upper limbs than in the lower limbs. For a good fit to the data, it was necessary to specify a correlation between the errors of items 8 and 9, which indicates that both items have a unique shared variance. This finding has been described previously10,11 and has theoretical support. The correlation between the items "moving heavy objects" and "lifting heavy objects" can be explained by their being two very similar tasks, i.e., people generally try to lift objects to move them.
The magnitude and direction of the correlations between the total score of the Spanish version of the HAQ-II with other variables is consistent with correlations published in previous studies: with pain intensity of .46–.61,4,10,11 .55 with fatigue,4 .55 with the DAS28,11 .44 with depressive symptoms,4 .38 with symptoms of anxiety4 and .91–.92 with the HAQ-DI.4,10,11 These results demonstrate its validity based on the relationship with other variables.
IRT-based analysis aims to produce reliable scores that can be used to make valid inferences about subjects.38 Different types of models represent different theoretical perspectives.39 A model is useful to the extent that it provides reasonable predictions of the probabilities of selecting a response to an item and the person's place on the scale simultaneously.39 Two previous studies reported a good fit of the data to the Rasch model, which implies that all items have the same discrimination and measure a single dimension.4,10 Another study demonstrated an adequate fit to the GPCM,9 which enables varying discrimination between items.
In this study we examined the fit to different types of IRT models. In contrast to previous studies, the results show that neither the unidimensional models (GPCM and GRM) nor the Rasch model (PCM) accurately represented the item-person interaction in our sample. The 2-dimensional MGRM represented the interaction between patients and HAQ-II items more accurately. In other words, the items are sensitive to differences in activities that predominantly require upper limb functioning from activities that predominantly require lower limb functioning and the differences in the functional limitation of individuals required 2 domains to be accurately represented. The marginal reliability coefficient of the estimates of the dimension score36 shows that the HAQ-II appropriately ranks respondents across the latent trait level.
The high correlation between the scores estimated by item averaging and the θ value obtained from the MGRM indicates that item averaging provides similar latent trait scores. The agreement between the HAQ-II and HAQ-DI scores in our study is consistent with that of Wolfe et al. (CCC = .902; bias = .02).4 This indicates that both scales assess similar constructs, but are not interchangeable at the individual level.4,10
The limitations to be considered when interpreting the study are that due to its design some psychometric properties were not assessed (test-retest reliability, predictive validity and sensitivity to change); the study does not include a significant percentage of patients with low literacy, who may have greater difficulty in understanding the items; the sample did not come from the general population and we did not assess whether patients have a preference for the HAQ-II compared to the HAQ-DI. However, the participants’ educational level is equivalent to the estimated average for the Mexican population and a sample was used of patients who make up the target population for the HAQ-II.
ConclusionThe Spanish version of the HAQ-II has an adequate degree of validity and reliability to measure functional capacity in Mexican patients with rheumatoid arthritis.
FundingThis research study has received no specific support from public sector agencies, the commercial sector, or non-profit organisations.
Conflict of interestsThe author has no conflict of interests to declare.
The following is Supplementary data to this article:

Please cite this article as: Horta-Baas G. Validación de una versión en español del Health Assessment Questionnaire-II para la evaluación de la capacidad funcional en pacientes mexicanos con artritis reumatoide. Reumatol Clin. 2022;18:236–245.


