


To analyze pre-surgical predictive factors of post-surgical pain in patients undergoing hip or knee arthoplasty.
MethodsA systematic literature review was performed. We defined a sensitive strategy on Medline, Embase and Cochrane Library up to May 2013. The inclusion criteria were: patients undertaking knee and/or hip arthroplasty, adults with moderate or severe pain (≥4 on a Visual Analog Scale) in whom predictive factors of post-surgical pain were evaluated before surgery. Systematic reviews, meta-analyses, controlled trials and observational studies were selected. We excluded animals and basic science articles, reviews of prosthesis, prosthesis due to fractures, patients with rheumatic diseases or studies with mixed population in which disaggregated data was not possible to obtain.
ResultsA total 37 articles of moderate quality were selected. The articles included representative patients undergoing a knee or hip arthroplasty in our country; most of them were aged 60 years or above, with osteoarthritis, and with a high rate of obesity and comorbidities. We found great variability regarding the type of studies and predictive factors. There was a strong association between post-surgical pain and the following pre-surgical factors: female gender, low socio-economic status, higher pain, comorbidities, low back pain, poor functional status, and psychological factors (depression, anxiety or catastrophic pain).
ConclusionsThere are pre-surgical factors that might influence post-surgical pain in patients undergoing a knee or hip arthroplasty. Therefore, they should be taken into account when considering an arthroplasty.
Analizar los factores prequirúrgicos que pueden tener efecto sobre los niveles de dolor posquirúrgico en pacientes que van a ser sometidos a una artroplastia de cadera (ATC) o rodilla (ATR).
MétodosRevisión sistemática de la literatura. Se definió una estrategia de búsqueda sensible en Medline, Embase y Cochrane Library hasta mayo de 2013; se definió la población con los siguientes criterios: pacientes adultos con indicación de ATC o ATR y en los que se identificasen factores predictores prequirúrgicos de dolor posquirúrgico. Se incluyeron revisiones sistemáticas, metaanálisis, ensayos clínicos y estudios observacionales. Se excluyeron estudios en animales, ciencia básica, estudios sobre revisiones de prótesis, prótesis por fracturas, pacientes que tenían una enfermedad inflamatoria articular de base (artritis reumatoide, lupus, etc.) o estudios con población mixta donde fue imposible desagregar datos.
ResultadosSe seleccionaron 37 artículos de calidad moderada. Incluían pacientes representativos de aquellos a los que se les indica una ATC o ATR en nuestro país, la gran mayoría tenían artrosis de rodilla y/o cadera y más de 60 años, muchos obesos y con comorbilidades. Existe una gran variabilidad en el tipo de estudios y factores estudiados. Se encontró una fuerte y consistente asociación con mayor dolor posquirúrgico de los siguientes factores prequirúrgicos: el sexo femenino, el bajo nivel socioeconómico, un mayor nivel de dolor preoperatorio, la presencia de comorbilidades o dolor lumbar, un peor estado funcional preoperatorio, la presencia de factores psicológicos (depresión, ansiedad o catastrofismo).
ConclusionesExisten factores prequirúrgicos que pueden influir en la presencia de dolor posquirúrgico en pacientes sometidos a ATC y/o ATR que deben tenerse en cuenta en el momento de la indicación y hasta que se realiza la misma.
Total knee arthroplasty (TKA) or total hip arthroplasty (THA) can bring about an enormous improvement in terms of pain relief and restored function in the patients who undergo these interventions to treat osteoarthritis (OA), with the resulting improvement in quality of life,1,2 and, thus, are considered among the most relevant surgical advances of the 20th century.3 However, this effect is not obtained in all the patients in which this surgical technique is performed.4 In fact, up to 30% of the patients who undergo these procedures in Spain report no substantial improvement in their quality of life one year after surgery.5
A number of studies have suggested that certain preoperative factors may have an effect on these outcomes. In general, both in THA and TKA, the best results (at least with respect to function and prosthesis survival) are obtained in patients between 45 and 75 years of age, with strong social support and a high level of education, without overweight/obesity, with better preoperative function and no comorbidities, among other characteristics.6–8 When the effect on postoperative pain is analyzed, other studies mention factors related to the patient, the surgical technique and other aspects that are associated with greater pain after surgery.9 However, there is no critically evaluated information in this respect, especially concerning chronic postoperative pain.
Our objective was to carry out a systematic and critical review of the available literature to identify possible preoperative factors that have an impact on postoperative pain in patients in whom THA or TKA is indicated. Although the size of the effect of these possible factors cannot be analyzed in depth, simply identifying them may be of great help to practicing clinicians in making decisions regarding hip and knee replacements.
Materials and MethodsWe carried out a systematic review of the literature in accordance with the recommendations of the Cochrane Collaboration.10
Study Selection CriteriaWe selected studies that included adult patients in whom THA and/or TKA was indicated. Moreover, these studies should analyze preoperative predictive or determining factors for postoperative pain such as: age, sex, level of education, socioeconomic status, race, profession, underlying disease (type, duration, etc.), comorbidity, body mass index (BMI), level of self-care ability, quality of life, preoperative pain level (intensity, duration, etc.), surgeon-related factors (age, sex, experience), waiting list, type of hospital, expectations, depression, anxiety, etc. Finally, only studies with the following designs were included: meta-analyses, systematic reviews, clinical trials or observational studies.
Animal studies, basic science studies, studies on prosthesis revisions or prostheses to treat fractures were excluded, as were studies in which all the patients had an underlying inflammatory joint disease (rheumatoid arthritis, lupus, etc.) or that provided data only on these patients, and studies involving a mixed study population, but in which it was impossible to dissociate this subpopulation.
Search StrategyFor this review, we screened the following bibliographic databases: MEDLINE (from its inception to May 2013), EMBASE (from its inception to May 2013) and the Cochrane Library (from its inception to May 2013). Given the volume of literature that we expected to find, we decided, on the one hand, to include those articles in which the analysis had been adjusted for those factors that might influence the association and, on the other, not to search in the gray literature (abstracts from Spanish and international congresses). Subsequently, we carried out a secondary hand search of references from the articles that ultimately were included in the systematic review.
The strategies used in the MEDLINE search, as well as the number of citations retrieved, are shown in Table 1. For this purpose, we utilized MeSH terms and free-text terms. The search was limited to articles in humans and in English or Spanish.
Search Strategy in MEDLINE.
| 7 | #6 Filters: Humans; English; Spanish | 2977 |
|---|---|---|
| 6 | #4 AND #5 | 3258 |
| 5 | ((((((((((((((((“Review”[Publi[cation Type] OR Review, Systematic OR Review, Multicase OR Review Literature OR Review, Academic OR Review of Reported Cases OR Review)) OR (((“Clinical Trial”[Publication Type]) OR “Validation Studies”[Publication Type]) OR “Evaluation Studies”[Publication Type])) OR (“Clinical Trial, Phase I”[Publication Type] OR Clinical Trial, Phase 1)) OR (“Clinical Trial, Phase II”[Publication Type] OR Clinical Trial, Phase 2 OR Clinical Trial, Phase II)) OR (“Clinical Trial, Phase III”[Publication Type] OR Clinical Trial, Phase 3 OR Clinical Trial, Phase III)) OR (“Clinical Trial, Phase IV”[Publication Type] OR Clinical Trial, Phase 4 OR Clinical Trial, Phase IV)) OR (“Controlled Clinical Trial”[Publication Type])) OR (“Multicenter Study”[Publication Type] OR Multicenter Studies OR Multicenter Study)) OR (“Randomized Controlled Trial”[Publication Type] OR Randomized Controlled Trial)) OR (“Cohort Studies”[Mesh] OR Cohort Study OR Studies, Cohort OR Study, Cohort OR Concurrent Studies OR Studies, Concurrent OR Concurrent Study OR Study, Concurrent OR Historical Cohort Studies OR Studies, Historical Cohort OR Cohort Studies, Historical OR Cohort Study, Historical OR Historical Cohort Study OR Study, Historical Cohort OR Analysis, Cohort OR Analyses, Cohort OR Cohort Analyses OR Cohort Analysis OR Closed Cohort Studies OR Cohort Studies, Closed OR Closed Cohort Study OR Cohort Study, Closed OR Study, Closed Cohort OR Studies, Closed Cohort OR Incidence Studies OR Incidence Study OR Studies, Incidence OR Study, Incidence OR Cohort Studies)) OR (“Cohort Studies”[Mesh] OR cohort study OR studies, cohort OR study, cohort OR concurrent studies OR studies, concurrent OR concurrent study OR study, concurrent OR historical cohort studies OR studies, historical cohort OR cohort studies, historical OR cohort study, historical OR historical cohort study OR study, historical cohort OR analysis, cohort OR analysis, cohort OR cohort analyses OR cohort analysis OR closed cohort studies OR cohort studies, closed OR closed cohort study OR cohort study, closed OR study, closed cohort OR studies, closed cohort OR incidence studies OR incidence study OR studies, incidence OR study, incidence OR cohort studies)) OR (“Longitudinal Studies”[Mesh] OR Longitudinal Study OR Studies, Longitudinal OR Study, Longitudinal OR Longitudinal Survey OR Longitudinal Surveys OR Survey, Longitudinal OR Surveys, Longitudinal OR Longitudinal Studies)) OR (“Follow-Up Studies”[Mesh] OR Follow Up Studies OR Follow-Up Study OR Studies, Follow-Up OR Study, Follow-Up OR Followup Studies OR Followup Study OR Studies, Followup OR Study, Followup OR Follow-Up Studies)) OR (“Prospective Studies”[Mesh] OR Prospective Study OR Studies, Prospective OR Study, Prospective OR Prospective Studies)) OR (“meta-analysis”[Publication Type] OR “meta-analysis as topic”[MeSH Terms] OR “meta-analysis”[All Fields])) | 4426305 |
| 4 | #1 AND #2 AND #3 | 4729 |
| 3 | Risk factors[MH] OR causalities OR multifactorial causality OR causalities, multifactorial OR causality, multifactorial OR multifactorial causalities OR multiple causation OR causation, multiple OR causations, multiple OR multiple causations OR reinforcing factors OR factors, reinforcing OR factors, reinforcing OR reinforcing factor OR causation OR causations OR enabling factors OR enabling factor OR factors, enabling OR factors, enabling OR predisposing factors OR factors, predisposing OR factors, predisposing OR predisposing factor OR determinant OR predictor OR predict* OR prognostic | 1542865 |
| 2 | Search “pain, postoperative”[MeSH Terms] OR (“pain”[All Fields] AND “postoperative”[All Fields]) OR “postoperative pain”[All Fields] OR (“postoperative”[All Fields] AND “pain”[All Fields]) OR (“pain, postoperative”[MeSH Terms] OR (“pain”[All Fields] AND “postoperative”[All Fields]) OR “postoperative pain”[All Fields] OR (“postoperative”[All Fields] AND “pains”[All Fields]) OR “postoperative pains”[All Fields]) OR “pain”[MeSH Terms] OR “pain”[All Fields] | 536118 |
| 1 | Osteoarthritides OR Osteoarthrosis OR Osteoarthroses OR Arthritis, Degenerative OR Arthritides, Degenerative OR Coxarthrosis OR Arthroplasties, Replacement, Hip OR Arthroplasties, Replacement, Hip OR Hip Prosthesis Implantation OR Hip Replacement, Total OR Hip Replacements, Total OR Arthroplasties, Replacement, Knee OR Knee Replacement, Total OR Knee Replacements, Total | 315207 |
Two reviewers independently analyzed the articles resulting from the search strategy in the three bibliographic databases, selected those that met the defined criteria and analyzed the included articles in depth. When there was disagreement, a third person, in this case, an expert methodologist, resolved the problem. First, the results of the search were refined according to the title and abstract, or the entire article when there was no abstract, in sessions with a maximum duration of 20min. After this process, the selected articles were analyzed in depth (a reading of the entire article). Figure 1 shows the flowchart corresponding to the article selection process.

Finally, we performed a manual search for the works included in the reference lists of the articles selected for in-depth analysis. All the references were retrieved from the Internet and stored in the EndNote program to facilitate their use.
Data Collection and Appraisal of the Quality of the StudiesThe two reviewers extracted the data from the selected studies using specific templates predesigned for this review. To evaluate the methodological quality of the studies included, they used the Oxford quality scale.11
Data Analysis and PresentationWe created evidence tables to describe the main features of the selected studies. Some of the results are expressed as number and percentage (%), mean and standard deviation, median and interquartile range (P25–P75), and others as odds ratio, relative risk or hazard ratio and their 95% confidence intervals (CI). On the other hand, the predictive factors analyzed in each article are presented in the evidence tables and results section as crude and adjusted for other variables (which are also specified). The possibility of carrying out a meta-analysis was considered only in the case of homogeneity.
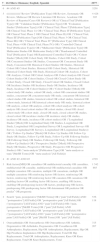
ResultsOriginally, we selected 92 articles, which were reviewed in depth. Of these, 33 were selected; 4 more were added after the secondary search (Tables 2 and 3). The excluded articles and the reason for their exclusion are shown in Table 4) (their complete bibliography is provided in Appendix A, additional online material). The main reason for exclusion was the failure to consider postoperative pain as the main outcome variable of the study. A total of 4 were systematic reviews (SR),12–15 and 1 randomized clinical trial16 and 32 observational studies (30 prospective, 2 retrospective) were included. Taking into account the fact that, in turn, the SR included 44 articles, this SR cites 77 different articles. In general, the quality was moderate and even high in some of them. Many articles scored in the range of 2 on the Oxford scale (Table 5).
Evidence Table.
| # | Study | Population | Predictive factor/s | Postoperative pain | Quality/comments* | |
|---|---|---|---|---|---|---|
| 1 | Allen Butler 2011,16 RCT, mean follow-up 3.2 years2–5 | n=108 THA (32% women, mean age 52 years) | -Quality of life (SF-12)-Income level-WOMAC-Race-Education level-≥2 medical comorbidities | -Thigh pain (drawing, yes/no)-Thigh pain (VAS) | -Oxford 1b-Small sample size | |
| 2 | Bartelt 2010,17 retrospective observational, 1-year follow-up | n=269 THA (53% women, age 22-94 years, 70% OA) | -Age-Sex-Diagnosis-BMI-Surgical technique | -Groin pain | -Oxford 3a | |
| 3 | Becker 2011,43 prospective observational, 8-month follow-up | n=102 TKA (72% women, mean age 71±8 years, 100% OA, 62% married, 32% living alone) | -Patient expectations (15-item questionnaire) | -WOMAC | -Oxford 3a-Small sample size | |
| 4 | Bin Nasser 2009,24 prospective observational, 12–61-month follow-up | n=116 THA (18% women, mean age 48 years, mean BMI 26.9) | -Age, sex, pain on hip flexion with knee extended, surgical approach, cup thickness, BMI, age, offset ratio, extent of cup coverage, internal rotation, impingement sign, cup inclination, stem-shaft angle, surgeon's experience | -Groin pain | -Oxford 2c-Small sample size | |
| 5 | Davis 2008,33 prospective observational, 2-year follow-up | n=974 TKA (60% women, median age 71 years, 0-4 comorbidities, median BMI 29, over 60% retired, median preop WOMAC 41) | -Income level-Education level | -WOMAC | -Oxford 2a | |
| 6 | Dohnke 2005,42 prospective observational, 6-month follow-up | n=1065 THA (62% women, mean age 65±10 years) | -Level of self-efficacy (modification of the Arthritis Self-Efficacy Scale) | -VAS | -Oxford 2b | |
| 7 | Elson 2006,18 prospective observational, 5-year-follow-up | n=512 TKA (54% women, mean age 69 years, mean BMI 29) | -Age (<60 years)-Sex (female)-Unilateral and 1st knee replacement-Cruciate ligament removed-Lateral approach | -AKSS | -Oxford 2b-One or more patients with RA | |
| 8 | Escobar 2007,19 prospective observational, 6-month follow-up | n=640 TKA (73.6% women, mean age 71±6 years, mean BMI 29±4, mean preop WOMACp 54±18, Charlson index ≥2 12%, social support 86%) | -Age-Sex-Comorbidity-Social support-Low back pain-Preop pain (WOMAC)-Mental health (SF-12) | -WOMAC | -Oxford 2a | |
| 9 | Fortin 1999,35 prospective observational, 6-month follow-up | n=177 (n=92 TKA, n=85 THA, 43% women, mean age 67±3 years, mean study duration 13±3 years, Charlson index 0–1, 100% OA) | -Age-Sex-Center-Education level-Comorbidity (CIRS, Charlson index)-Preop pain (WOMAC) | -WOMAC | -Oxford 2b | |
| 10 | Haanstra 2012,41 SR of observational studies, 2-week to 5-year follow-up | n=18 studies (moderate-high quality), 9 studies evaluated postop pain, include THA and TKA | -Level of self-efficacy-Patient expectationsDifferent methods of measuring both, 50% do not provide a clear definition) | -WOMAC | -Oxford 1c | |
| 11 | Halket 2010,31 prospective observational, 2–27-week follow-up | n=147 (46% women, mean age 62±10 years, mean BMI 30±5, 79 TKA, 29 THA) | -Age-Sex-Site of arthroplasty (knee or hip)-Preop pain-BMI | -WOMAC-40-m walk test-TUG-6-minute walk test-ST | -Oxford 3a-Small sample size | |
| 12 | Hawker 2013,40 prospective observational, follow-up up to 23 years | n=202 (79.7% women, mean age 71±7 years, 59.4% low income level, 19.8% high education level, mean preop WOMAC 47±17, 6.9% inflammatory arthritis, mean SF-36 52±22, 30.2% without comorbidities, 17.8% normal weight, 69 THA, 133 TKA) | -Age-Sex-Education level (low vs high)-Income level (low vs high)-Place of residence (urban vs rural)-Living alone (yes/no)-Employed (yes/no)-BMI-OA severity (WOMAC)-Diagnosis-No. of other hips or knees affected-Low back pain-Comorbidities-Joint (hip vs knee)-Year operated-Center-Time to 1st postop evaluation | -WOMAC | -Oxford 2b-One or more patients with inflammatory diseases | |
| 13 | Jones 2001,25 prospective observational, 6-month follow-up | n=454: 197 THA (62% women, 83% <80 years old, 32% live alone, 93% OA, mean no. comorbidities 3±2, mean BMI 29±5, 56% hybrid prostheses, 68% with no complications on admission, mean hospital stay 7±5 days), 257 TKA (59% women, 86% <80 years old, 22% live alone, 93% OA, mean no. comorbidities 3±2, mean BMI 31±5, 56% hybrid prostheses, 70% with no complications on admission, mean hospital stay 7±2 days) | -Age-Sex-Waiting list-Mean hospital stay-No. of comorbidities-Preop pain (SF-36)-Cementless prosthesis-Implant fixation | -WOMAC | -Oxford 2b-One or more patients with inflammatory diseases | |
| 14 | Jones 2012,20 prospective observational, 3-year follow-up | n=520: 231 THA (60% women, mean age 68±10 years, 28% live alone, 94% OA, 9% DM, 25% heart disease, no. comorbidities 3±2, 61% hybrid prostheses, mean hospital stay 7±4 days, 68% with no complications on admission), 289 TKA (59% women, mean age 69±9 years, 29% live alone, 94% OA, 13% DM, 24% heart disease, no. of comorbidities 3±2, 59% hybrid prostheses, mean hospital stay 6±2 days, 68% with no complications on admission) | -Age-Sex-BMI-Heart disease-DM | -WOMAC | -Oxford 2a-One or more patients with inflammatory diseases | |
| 15 | Judge 2012,26 prospective observational, 6-month follow-up | n=1617 TKA (63% women, mean age 70±9 years, mean BMI 30±5, right knee 53%, median IMD 2004 11.5, OA 96%, ASA status 1-2 84%, mean OKS 40±8, EQ5D without anxiety or depression 51%) | -Age-Sex-BMI-IMD 2004-Site (right or left)-Diagnosis-OKS-ASA status-Year operated | -OKS | -Oxford 2c-One or more patients with inflammatory diseases | |
| 16 | Lavernia 2009,39 prospective cohort, 3-year follow-up | n=62 THA (n=24 preop WOMACf ≥51, 50% women, mean age 59±16 years; n=38 preop WOMACf<51, 58% women, mean age 61±16 years)n=65 TKA (n=13 preop WOMACf ≥51, 85% women, mean age 69±8 years; n=52 preop WOMACf<51, 77% women, mean age 68±9 years) | -Function (WOMAC) | -WOMAC | -Oxford 4-Small sample size | |
| 17 | Li 2012,12 SR de RCT (and extensions), 12–97-month follow-up | n=24 studies on TKA (2799 patients, higher % women, mean ages 59-78 years), 7 evaluated postop pain | -Type of prosthesis: mobile-bearing vs fixed-bearing | -WOMAC | -Oxford 1a | |
| 18 | Louw 2013,13 SR of RCT, 1-week to 2-year follow-up | n=13 studies on THA and TKA (1021 patients, 58% women) | -Educational measures | -WOMAC-VAS-SF-MPQ | -Oxford 1b-Heterogeneity-Youngest patients excluded | |
| 19 | MacWilliam 1996,27 prospective observational, 6-month follow-up | n=442 THA (60% women, 57%>65 years, 22% low education level, 43% with comorbidity, 35% unmarried, 13% African American) | -Age-Sex-Race-Marital status-Education level-Comorbidity-Polyarticular disease-Preop pain-Preop function | -HSQ | -Oxford 2c-High number of study dropouts | |
| 20 | Nilsdotter 2009,22 prospective observational, 1-year and 5-year follow-up | n=102 THA (62% women, mean age 76 years, mean BMI 28, 36.5%≥2 comorbidities) | -Age-Sex-Comorbidity-Preop quality of life | -KOOS | -Oxford 2b-Small sample size | |
| 21 | Nuñez 2009,36 prospective cohort, 7-year follow-up | n=112 TKA (77% women, mean age 67±16 years, 62.5% basic education, 24.1% live alone, 89.3% retired, mean no. comorbidities 5±3, 51% BMI≥30) | -Age-Sex-Education level-Currently employed-Live alone (yes/no)-Disease duration-Other musculoskeletal pain-Comorbidity-Contralateral prosthesis-Surgical difficulty-Complications | -WOMAC | -Oxford 2c-Small sample size | |
| 22 | Papakostidou 2012,28prospective observational, 12-month follow-up | n=204 TKA (79% women, mean age 69±6 years, 17.6% with no social support, 96% OA, 52.9% BMI ≥30, mean waiting list 13±10 weeks, Charlson index 1.6) | -Age-Sex-BMI-Education level-Place of residence-Social support-Preop pain | -WOMAC | -Oxford 2b-Findings difficult to generalize to men, social support-One or more patients with inflammatory diseases | |
| 23 | Puolakka 2010,29 retrospective observational, 4- and 22-month follow-up | n=528 TKA (70% women, mean age 68±8 years, mean BMI 29±4, 96% OA, 42% continuous severe or moderate pain) | -Type of arthroplasty:√ primary√ bilateral√ revision | -Self-reported-Analgesic use | -Oxford 2c-High number of study dropouts-One or more patients with inflammatory diseases | |
| 24 | Quintana 2009,21 prospective observational, 6-month and 2-year follow-up | n=590 THA (48.6% women, 49% over 70 years, 69.5% married, 84.6% primary studies, 33.6% BMI≥30, 54.5% low back pain, 58.7% without comorbidities, 90.4% social support, 43% contralateral OA, mean waiting list 156±151 days) | -Age-Sex-Comorbidity-Mental health (SF-36)-Contralateral OA-Low back pain-Marital status-Social support-BMI-Previous hip disease-Expectations of relief-Preop pain (WOMAC) | -WOMAC | -Oxford 2c | |
| 25 | Rat 2010,302 prospective cohorts, 3-year and 10-year follow-up | THA and TKA3-year cohort: n=195 (57% women, mean age 72±8 years, 74% basic studies, mean BMI 28±4, 54% low back pain)10-year cohort: n=89 (56% women, mean age 73±11 years, 77% basic studies, mean BMI 30±14, 59% low back pain) | -Age-Sex-Joint type-Quality of life-Comorbidity-Environmental factors (WHOQOL-BREF)-No. of pain sites-Preop pain (OAKHQOL) | -OAKHQOL | -Oxford 2b-Methodological differences between the 2 cohorts | |
| 26 | Riddle 2011,44 quasi-experimental study, 2-month follow-up | n=63 TKAIntervention group: 67% women, mean age 63±11 yearsControl group: 73% women, mean age 60±9 years | -Behavioral intervention on pain catastrophizing | -WOMAC-Pain catastrophizing (PCS) | -Oxford 2b-Small sample size | |
| 27 | Rolfson 2009,45 prospective observational, 1-year follow-up | n=6158 THA (57% women, mean age 69 years, 100% OA) | -Anxiety (EQ5D)-Depression (EQ5D) | -VAS | -Oxford 2b | |
| 28 | Santaguida 2008,14SR of observational studies | n=64 studies, 3 evaluate postop pain | -Age-Sex-Race-Weight-Height-BMI-Socioeconomic status | -VAS-Behavioral scale | -Oxford 2a-Majority retrospective studies | |
| 29 | Singh 2008,23 prospective observational, 2-year and 5-year follow-up | 2-year follow-upn=5290 TKA (56% women, mean age 68±10 years, 95% OA) | 5-year follow-upn=2602 TKA (56% women, mean age 68±9 years, 94% OA) | -Age-Sex-Preop pain intensity | -Self-reported | -Oxford 2b-One or more patients with inflammatory diseases |
| 30 | Singh 2010a,9 prospective observational, 2-year and 5-year follow-up | 2-year follow-up n=5707 THA (51% women, mean age 65±13 years, 87% OA) | 5-year follow-upn=3289 THA (53% women, mean age 65±13 years, 85% OA) | -Age-Sex-BMI-Comorbidity-Depression-Anxiety | -Self-reported-Need for medication: NSAID and opioids | -Oxford 2b-One or more patients with inflammatory diseases |
| 31 | Singh 2013,38 prospective observational, 2-year and 5-year follow-up | 2-year follow-up n=7139 TKA (56% women, mean age 68±10 years) | 5-year follow-upn=4234 TKA (55% women, mean age 68±10 years) | -Comorbidity (Charlson)-Anxiety (H-ICDA)-Depression (H-ICDA) | -Self-reported | -Oxford 2c-Anxiety, depression underestimated |
| 32 | Singh 2010b,46 prospective observational, 2-year and 5-year follow-up n=702 | 2-year follow-up n=5707 TKA (61% women, mean age 68±9 years) | 5-year follow-upn=3289 TKA (59% women, mean age 68±9 years) | -Age-Sex-BMI-Comorbidity (Charlson)-Operating time-Surgeon-Pessimistic/optimistic explanatory style (ICD-9) | -Self-reported | -Oxford 2c-Time between predictor and pain may be prolonged |
| 33 | Smith 2012,32 prospective observational, 1 to 3-year follow-up | n=911 THA (63% women, mean age 67±11 years) | -Surgical procedure | -WOMAC | -Oxford 2b | |
| 34 | Sullivan 2011,37 prospective observational, 12-month follow-up | n=120 TKA (61% women, 87% married, mean age (range) 67 (50-85) years, mean BMI (range) 31 (20-45), 97% with at least 12 years of schooling | -Age-Sex-BMI-Comorbidity-Pain catastrophizing (PCS)-Fear of movement (TSK)-Depression (PHQ-9)-Patient expectations | -WOMAC | -Oxford 2c-Small sample size | |
| 35 | Thompson 2002,47 prospective observational, 6-month follow-up | n=1458 THA (57% women, mean age 67 years, deterioration of contralateral hip in 33% and of knee in 16%, 33% severe preop pain, 47% loss of mobility) | -Certified orthopedist-Caseload/surgeon-Caseload/hospital-Postgraduate studies-Proper management | -Matrix combining pain severity (0-5) with no. of activities in which pain appears (walking, climbing stairs, sitting down, lying down) | -Oxford 2b-Situation other than the current care-provider | |
| 36 | Vissers 2012,15 SR of observational studies, 6-week to 5-year follow-up | n=35 studies, include THA and TKA, 12 evaluated postop pain | -Psychological factors:√ depression√ anxiety√ coping skills√ optimism/pessimism√ pain catastrophizing√ mental health (SF-36)√ expectations√ emotional status√ fear of movement | -WOMAC-VAS-MPQ | -Oxford 2a | |
| 37 | Wylde 2011,34 prospective observational 4 years | n=1294: 662 THA (57% women, median age 73 years, 24% low education level, 28% weak social support), 632 TKA (61% women, median age 72 years, 19% low education level, 29% weak social support) | -Age-Sex-Education level-Social support | -WOMAC | -Oxford 2a |
AKSS, American Knee Society Score; ASA, American Society of Anesthesiologists; BMI, body mass index; CIRS, Cumulative Illness Rating Scale; DM, diabetes mellitus; EQ5D, Euroqol 5 dimensions; H-ICDA, Mayo Clinic's Hospital adaptation of International Code for Diseases codes; HSQ, Health Status Questionnaire; ICD-9, International Classification of Diseases – ninth revision codes; IMD 2004, Index of Multiple Deprivation; KOOS, Knee Injury and Osteoarthritis Outcome Score; MPQ, McGill Pain Questionnaire; NSAID, nonsteroidal anti-inflammatory drugs; OA, osteoarthritis; OAKHQOL, Osteoarthritis Knee and Hip Quality of Life questionnaire; OKS, Oxford Knee Score; PCS, Pain Catastrophizing Scale; PHQ-9, Patient Health Questionnaire; postop, postoperative; preop, preoperative; RA, rheumatoid arthritis; RCT, randomized clinical trial; SF-12, 12-Item Short Form Health Survey; SF-36, 36-Item Short Form Health Survey; SF-MPQ, Short Form McGill Pain Questionnaire; SR, systematic review; ST, Stair Test; THA, total hip arthroplasty; TKA, total knee arthroplasty; TSK, Tampa Scale for Kinesiophobia; TUG, Timed Up and Go Test; VAS, Visual Analog Scale; WHOQOL-BREF, World Health Organization Quality of Life BREF; WOMAC, Western Ontario McMasters University; WOMACf, WOMAC functional scale; WOMACp, WOMAC pain scale.
Preoperative factors predictive of postoperative pain (main outcome measures).
| Study | Predictor postop pain | Crude association | Adjusted association | Adjustment factors | |
|---|---|---|---|---|---|
| Allen Butler 201116 | -Quality of life (SF-12), income level, WOMAC, race, education level, ≥2 medical comorbidities/thigh pain (drawing, VAS) | – | -Thigh pain (drawing) was associated with a lower SF-12 mental component score (P=.006), and a trend toward poverty level (P=.060), WOMAC>51(P=.060) and African American race (P=.080)-Thigh pain (VAS≥3) was associated with a lower SF-12 mental component score (P=.010), African American race (P=.007), poverty level (P=.002), and a trend toward low education level (P=.060) and ≥2 comorbidities (P=.080) | -Not specified (it is a RCT) | |
| Bartelt 201017 | -Age, sex, BMI, diagnosis, surgical technique/groin pain | – | -Age (for every 10-year decrease) OR=1.38 (95% CI 1.05-1.81)-Dysplasia vs OA OR=2.67 (95% CI 1.00-1.74)-OA vs other diagnoses OR=1.19 (95% CI 0.37-3.78)-Sex (male) OR=1.15 (95% CI 0.51-2.59)-BMI (>25 vs <25) OR=0.80 (95% CI 0.32-2.00)-Conventional surgical technique vs metal-on-metal OR=2.45 (95% CI 0.73-8.19)-Conventional surgical technique vs resurfacing OR=2.95 (95% CI 1.10-7.91) | -See variables in preceding box | |
| Becker 201143 | -Patient expectations/pain (WOMAC) | – | -The patients with higher preop expectations had less postop pain (P<.050) | -Age, sex, BMI, socioeconomic status, preop WOMAC, preop AKSS, preop SF-36 | |
| Bin Nasser 200924 | -Age, sex, pain on hip flexion with knee extended, surgical approach, cup thickness, BMI, age, offset ratio, extent of cup coverage, internal rotation, impingement sign, cup inclination, stem-shaft angle, surgeon's experience/groin pain | – | -Female sex (P=.030)-Pain on hip flexion with knee extended (P=.060)-Surgical approach (P=.990)-Cup thickness (P=.350)-BMI (P=.650)-Age (P=.630)-Offset ratio (P=.580)-Extent of cup coverage (P=.830)-Internal rotation (P=.800)-Impingement sign (P=.110)-Cup inclination (P=.730)-Stem-shaft angle (P=.720)-Surgeon's experience (P=.840) | -See variables in preceding box | |
| Davis 200833 | -Income level, education level/pain (WOMAC) | – | -Income level (low) was associated with worse WOMAC at 12 months (P=.014) but not at 2 years-Education level was not associated with WOMAC at any time during follow-up | -Age, sex, no. of comorbidities, country, center | |
| Dohnke 200542 | -Preop self-efficacy level/pain (VAS) | – | -The greater the preop self-efficacy the lesser the postop pain, β coef=–0.20 (P<.010) | -Age, sex | |
| Elson 200618 | -Age (<60 years), sex (female), unilateral prosthesis or 1st of 2 knees, cruciate ligament removed, lateral approach/pain (AKSS) | -Age (<60 years) P<.010-Sex (female) NS-Unilateral prosthesis or 1st of 2 knees P<.010-Cruciate ligament removed P<.010-Lateral approach P<.010 | -Age (<60 years) P<.050-Sex (female) NS-Unilateral prosthesis or 1st of 2 knees P<.010-Cruciate ligament removed P<.010-Lateral approach P<.050 | -See variables in preceding box | |
| Escobar 200719 | -Age, sex, comorbidity, social support, low back pain, preop pain (WOMAC), mental health (SF-12)/pain (WOMAC) | – | -Age: β coef =–0.24 (95% CI –0.45 to –0.03)-Sex (female): β coef=–3.30 (95% CI –0.15 to 6.81)-Comorbidity (n=1): β coef=3.04 (95% CI –0.07 to 3.16)-Comorbidity (≥2): β coef=6.50 (95% CI 2.00 to 11)-Social support (yes): β coef=–5.13 (95% CI –9.31 to –0.35)-Low back pain: β coef=–5.26 (95% CI –8.24 to –2.27)-Preop pain (WOMAC): β coef=0.26 (95% CI 0.18–0.34)-Mental health (SF-12): β coef=–0.10 (95% CI –0.17 to –0.04) | -See variables in preceding box | |
| Fortin 199935 | -Age, sex, center, education level, comorbidity, preop pain (WOMAC)/pain (WOMAC) | – | -THA:Preop WOMAC β coef=0.27Education level β coef=–0.18 | -TKA:Preop WOMAC β coef=0.44 | -See variables in 2nd box |
| Haanstra 201241 | -Self-efficacy level, patient expectations/pain (WOMAC) | -Self-efficacy level: NS-Patient expectations: indeterminate | -Self-efficacy level: indeterminate-Patient expectations: indeterminate | Depends on each study type | |
| Halket 201031 | -Age, sex, prosthesis site (knee or hip), preop pain, BMI/WOMAC, 40-meter walk test, TUG, 6-min walk test, ST/pain (WOMAC, 40-m walk test, TUG, 6-min walk test, ST) | – | -WOMAC:Knee vs hip β coef=1.69 (95% CI 0.85–2.64)Preop pain β coef=0.24 (95% CI 0.12–0.36)-40-m walk test: female sex β coef=0.59 (95% CI 0.20–0.98)-TUG:female sex β coef=0.56 (95% CI 0.20–0.93)-6-min walk test:Preop pain β coef=0.24 (95% CI 0.12–0.36)-ST:female sex β coef=0.8 (95% CI 0.01–0.22) | -See variables in 2nd box | |
| Hawker 201340 | -Age, sex, education level (low vs high), income level (low vs high), place of residence (urban vs rural), living alone (yes vs no), employed (yes vs no), BMI, OA severity (WOMAC), diagnosis, no. of other hips or knees affected, low back pain, comorbidities, joint (hip vs knee), year operated, center, time to 1st postop evaluation/pain (WOMAC) | – | -Hip vs knee (P=.040), greater improvement in hip | -See variables in 2nd box | |
| Jones 200125 | -Age, sex, waiting list, mean hospital stay, no. of comorbidities, preop pain (SF-36), cementless prosthesis/pain (WOMAC) | – | THA:-Age β coef=–0.01 P=.91-Female sex β coef=0.16 P=.02-Waiting list β coef=0.02 P=.80-Mean hospital stay β coef=0.10 P=.12-No. of comorbidities β coef=–0.18 P=.01-Preop pain (SF-36) β coef=–0.43 P<.001-Cementless prosthesis β coef=–0.16 P=.05 | TKA:-Age β coef=0.03 P=.58-Female sex β coef=–0.03 P=.68-Waiting list β coef=0.05 P=.40-Mean hospital stay β coef=–0.12 P=.05-No. of comorbidities β coef=–0.06 P=.31-Preop pain (SF-36) β coef=–0.33 P<.001-Cementless prosthesis β coef=–0.17 P=.01 | -See variables in preceding box |
| Jones 201220 | -Age, sex, BMI, heart disease, DM/pain (WOMAC) | – | THA:-Age β coef=–0.06 P=.47-Female sex β coef=2.58 P=.12-BMI>35 β coef=5.91 P=.014-Heart disease β coef=4.71 P=.014-DM β coef=2.15 P=.44 | TKA:-Age β coef=–0.25 P=.007-Female sex β coef=–7.67 P<.001-BMI>35 β coef=4.01 P=.059-Heart disease β coef=1.61 P=.404-DM β coef=0.27 P=.921 | -Education level, living alone, mean hospital stay, type of prosthesis, diagnosis, complications on admission, rehab, no. of comorbidities |
| Judge 201226 | -Age, sex, BMI, IMD 2004, site (right or left), ASA status, OKS, diagnosis, year operated/pain (OKS) | -Preop pain (OKS) β coef=1.54 (95% CI 1.30 to 1.78)-Age NS-Female sex NS-BMI NS-IMD 2004 β coef=–0.69 (95% CI –0.95 to –0.43)-Right vs left NS-RA vs OA β coef=1.68 (95% CI 0.55–2.82)-ASA status 3 vs 2 NS-ASA status 1 vs 2 NS-Year operated NS-EQ5D moderately anxious/depressed vs no anxiety/depression β coef=–0.48 (95% CI –0.87 to –0.08)-EQ5D very anxious/depressed vs no anxiety/depression β coef=–1.09 (95% CI –2.10 to –0.08) | -Preop pain (OKS) β coef=1.30 (95% CI 1.03–1.57)-Age β coef=0.01 (95% CI –0.10 to 0.12)-Female sex β coef=–0.13 (95% CI –0.52 to 0.25)-BMI β coef=–0.13 (95% CI –0.36 to 0.09)-IMD 2004 β coef=–0.64 (95% CI –0.91 to –0.37)-Right vs left β coef=0.13 (95% CI –0.50 to 0.23)-RA vs OA β coef=1.75 (95% CI 0.61–2.89)-ASA status 3 vs 2 β coef=0.18 (95% CI –0.40 to 0.75)-ASA status 1 vs 2 β coef=0.51 (95% CI –0.12 to 1.14)-Year operated NS-EQ5D moderately anxious/depressed vs no anxiety/depression β coef=–0.43 (95% CI –0.82 to –0.03)-EQ5D very anxious/depressed vs no anxiety/depression β coef=–1.19 (95% CI –2.19 to –0.18) | -See variables in preceding box | |
| Lavernia 200939 | -Function (WOMAC)/pain (WOMAC) | – | -THA: the worse the preop function, the worse the postop pain (P<.001)-TKA: the worse the preop function, the worse the postop pain (P=.006)-The differences persist at 1, 2 and 3 years | -Age, sex | |
| Li 201212 | -Type of prosthesis: mobile-bearing vs fixed-bearing/pain (WOMAC) | – | -Mobile-bearing prosthesis: OR=0.66 (95% CI 0.46-0.94) P=.022 I2=25.5% | -Not specified | |
| Louw 201313 | -Educational measures/pain (WOMAC), VAS, SF-MPQ | – | -Educational measures produced no effect on postop pain except in 1 of the 13 studies | -Not specified, although similarity among the groups is assumed due to randomization | |
| MacWilliam 199627 | -Age, sex, race, marital status, education level, comorbidity, polyarticular disease, preop pain (HSQ), preop function/pain (HSQ) | Difference in means (95% CI)-Age≥65: 2.7 (–2.6 to 8.0)-Female sex: 4.3 (–1.0 to 9.6)-African American: –9.2 (–17.2 to –1.2)-Unmarried: 2.7 (–2.9 to 8.3)-Low education level: –4.4 (–10.7 to 1.9)-Polyarticular disease: –1.9 (–7.5 to 3.7)-No. of comorbidities: –2.7 (–5.6 to 0.3)-Preop pain: –0.6 (–0.8 to –0.5) | Difference in means HSQ pain (95% CI)-Age≥65: 4.4 (–0.7 to 9.5)-African American: –9.5 (–16.9 to –2.1)-Low education level: –6.2 (–12.3 to –0.1)-No. of comorbidities: –4.6 (–7.5 to –1.7)-Preop pain (HSQ): –0.7 (–0.5 to –0.9)-Preop function: –0.6 (–0.8 to –0.5)-Female sex, unmarried, polyarticular: NS | -See variables in 2nd box | |
| Nilsdotter 200922 | -Age, sex, comorbidity, preop quality of life/pain (KOOS) | – | -Pain at 1 year: age (being 10 years older) coef=5 (95% CI 1–10)-Pain at 5 years: age (being 10 years older) coef=7 (95% CI 1–13)-Sex, comorbidity, preop quality of life: NS | -See variables in 2nd box | |
| Nuñez 200936 | -Age, sex, education level, currently employed, living alone (yes or no), disease duration, other musculoskeletal pain, comorbidity, contralateral prosthesis, surgical difficulty, complications/pain (WOMAC) | – | -BMI >35kg/m2 coef=9.7 (95% CI 4.3–14.4) | -Age, sex, comorbidity | |
| Papakostidou 201228 | -Age, sex, BMI, education level, place of residence, social support, preop pain/pain (WOMAC) | – | Difference between categories (95% CI)-Preop pain=0.10 (95% CI 2.29–0.02); (P=.020)-Age, sex, low education level, BMI, rural vs urban, social support: NS | -See variables in 2nd box | |
| Puolakka 201029 | -Age, sex, type of arthroplasty, preop pain/pain (self-reported), analgesic use | – | -Preop pain >12 months OR=2.84 (1.44–8.65)-Female sex OR=1.91 (1.14–3.28)-Age, BMI, diagnosis: NS | -Type of prosthesis | |
| Quintana 200921 | -Age, sex, comorbidity, mental health (SF-36), contralateral OA, low back pain, marital status, social support, BMI, previous hip deterioration, expectations of relief, preop pain (WOMAC)/pain (WOMAC) | -Age coef=0.50-Female sex coef=0.56-Education level coef=0.001-Marital status coef=0.15-Social support coef=0.19-BMI coef=0.15-Previous hip deterioration coef=0.57-Contralateral OA coef=0.43-OA in lower limb coef=0.92-Low back pain coef=0.16-Comorbidity (Charlson) coef=0.92-Expectations of pain relief coef=0.002-Mental health (SF-36) coef=0.002-Preop pain coef=0.001 | Pain at 6 months:-Preop pain coef=–8.85 (P<.001)-Preop mental health (SF-36) coef=–0.32 (P=.010)-Age (>70) coef=–2.93 (P=.04)-Contralateral OA coef=3.95 (P=.006)-Sex, comorbidity, low back pain: NSPain at 2 years:-Preop pain coef=8.66 (P<.001)-Mental health (SF-36) coef=0.71 (P<.001)-Low back pain coef=–5.32 (P=.004)-Age, sex, comorbidities, contralateral OA: NS | -See variables in 2nd box | |
| Rat 201030 | -Age, sex, type of joint, quality of life, comorbidity, environmental factors (WHOQOL-BREF), no. of pain sites, preop pain (OAKHQOL)/pain (OAKHQOL) | – | Pain at 3 years:-Age: NS-Preop pain coef=0.28 (P<.001)-Pain other regions coef=12.93 (P<.001)-Comorbidity coef=–2.37 (P=.006)-Environmental factors coef=0.33 (P<.001)Pain at 10 years:-Age coef=0.44 (P=.07)-Preop pain: NS-Pain other regions coef=21.1 (P=.001)-Comorbidity coef=–3.36 (P=.02)-Environmental factors coef=0.39 (P=.005) | -Sex, marital status, location: hip or knee | |
| Riddle 201144 | -Behavioral intervention on pain catastrophizing/pain (WOMAC), pain catastrophizing (PCS) | Intervention (change baseline-end):-WOMAC=6.9±4.7-PCS=19.6±9.6Control (change baseline-end)-WOMAC=2.6±4.8-PCS=2.6±4.8 | Adjusted mean difference:-WOMAC=2.8 (95% CI 0.5–5.1) (P=.017)-PCS=9.1 (95% CI 3.3–14.9) (P=.003) | -Unspecified baseline characteristics | |
| Rolfson 200945 | -Anxiety (EQ5D), depression (EQ5D)/pain (VAS) | – | -Preop anxiety and depression: pain reduction 4.4% lower (P<.001) | -Comorbidity (Charnley), age, sex, preop EQ5D | |
| Santaguida 200814 | -Age, sex, race, weight, height, BMI, socioeconomic status/pain (VAS), pain (behavioral scale) | – | -THA=women experience less pain than men-TKA=women >65 years of age experience less pain-TKA=women experience more pain and take more analgesics | -See variables in 2nd box | |
| Singh 200823 | -Age, sex, preop pain intensity/pain (self-reported) | Pain at 2 years:-Age 60-70 years OR=0.58 (P<.05)-Age 70-80 years OR=0.69 (P<.05)-Age >80 years OR=1.12 NS-Female sex OR=1.40 (P<.05)-Preop pain OR=1.37 NSPain at 5 years:-Age 60-70 years OR=0.59 (P<.05)-Age 70-80 years OR=0.66 NS-Age >80 years OR=0.64 NS-Female sex OR=1.23 NS-Preop pain OR=4.93 NS | Pain at 2 years:Age 60-70 years OR=0.49 (95% CI 0.31–0.77)Female sex OR=1.45 (95% CI 1.01–2.08)Pain at 5 years:-No predictor reaches statistical significance | -See variables in 2nd box | |
| Singh 2010a9 | -Age, sex, BMI, comorbidity, depression, anxiety/pain (self-reported), need for NSAID and opioids | – | -BMI 35-39 OR=1.8 (95% CI 1.2–2.6)-BMI≥40 OR=1.7 (95% CI 1.0–2.9)-Depression OR=2.1 (95% CI 1.4–3.0)-Age, sex, anxiety, comorbidity: NS | -Underlying disease, distance from hospital, type of implant, income level, ASA status | |
| Singh 201338 | -Comorbidity (Charlson), anxiety (H-ICDA), depression (H-ICDA)/pain (self-reported) | Pain at 2 years-COPD OR=1.4 (95% CI 1.1–1.8)-DM OR=1.3 (95% CI 1.0–1.8)-Depression OR=1.5 (95% CI 1.2–2.0)-Anxiety OR=1.6 (95% CI 1.2–2.3)-Heart disease, PVD, renal disease, connective tissue disease: NSPain at 5 years-Heart disease OR=1.0 (95% CI 0.7–1.5)-DM OR=1.3 (95% CI 1.0–1.8)-Depression OR=1.5 (95% CI 1.2–2.0)-Anxiety OR=1.6 (95% CI 1.2–2.3)-COPD, PVD, renal disease, connective tissue disease: NS | Pain at 2 years-COPD OR=1.3 (95% CI 1.0–1.8) (P=.060)-Depression OR=1.3 (95% CI 1.0–1.8) (P=.080)-Anxiety OR=1.4 (95% CI 1.0–2.0) (P=.050)-Heart disease, renal disease, connective tissue disease, DM: NSPain at 5 years-Heart disease OR=1.7 (95% CI 1.1–2.6) (P=.010)-Depression OR=1.7 (95% CI 1.1–2.5) (P=.010)-Anxiety OR=1.9 (95% CI 1.2–3.1) (P<.010)-COPD, PVD, renal disease, connective tissue disease, DM: NS | -Sociodemographic factors, BMI, ASA status, distance from hospital, underlying disease, implant fixation | |
| Singh 2010b46 | -Age, sex, BMI, comorbidity (Charlson), operative time, surgeon, pessimistic/optimistic explanatory style (ICD-9)/pain (self-reported) | – | -Pain at 2 years pessimistic explanatory style OR=2.21 (95% CI 1.12–4.35)-Pain at 5 years pessimistic explanatory style OR=1.21 (95% CI 0.51–2.83) | -Age, sex, depression, distance from hospital | |
| Smith 201232 | -Surgical procedure/pain (WOMAC) | – | OR (95% CI) (P value)-Time elapsed since surgery OR=0.98 (95% CI 0.97–0.99)-Female sex OR=0.76 (95% CI 0.57–1.00) (P=.050)-Mental health OR=1.05 (95% CI 1.04–1.06) (P<.001)-Posterior vs anterolateral approach OR=1.61 (95% CI 1.26–2.05) (P<.001)-Cementless vs cemented fixation OR=1.55 (95% CI 1.20–2.01) (P=.001) | -Age | |
| Sullivan 201137 | -Age, sex, BMI, comorbidity, pain catastrophizing (PCS), fear of movement (TSK), depression (PHQ-9), patient expectations/pain (WOMAC) | – | -Preop pain catastrophizing predicts worse outcome in terms of pain (coef=0.44; P<.001)-Fear of movement and depression also predict greater postop pain, but only in univariate analyses-Effect mediated by patient expectations for response and recovery | -Patient expectations regarding the recovery of behavioral activities (daily tasks and social activities) | |
| Thompson 200247 | -Certification in orthopedics, caseload/surgeon, caseload/hospital, postgraduate studies, proper management/matrix that combines pain severity (0-5) with number of activities in which pain appears (walking, climbing stairs, sitting down, lying down) | – | Cemented prostheses-Postop pain is not associated with caseload (surgeon/hospital)Cementless prostheses-Postop pain is not associated with caseload (surgeon/hospital)-Certification as orthopedist 0.39 (95% CI 0.19–0.78) | -See box 2 | |
| Vissers 201215 | -Psychological factors (depression, anxiety, coping skills, optimism, pessimism, pain catastrophizing, mental health (SF-36), expectations, emotional status, fear of movement/pain (WOMAC, VAS, MPQ) | – | Pain <1 year after surgery-Robustly associated with greater pain are: poorer preop mental health, preop pain catastrophizingPain >1 year after surgery-Poorer preop mental health is robustly associated with greater pain | ||
| Wylde 201134 | Age, sex, education level, social support/WOMAC | – | THA:-age: OR=0.99 (95% CI 0.97-1.01)-Sex: OR=1.16 (95% CI 0.74-1.69)-Low education level: OR=1.18 (95% CI 0.71-1.98)-Weak social support: OR=0.72 (95% CI 0.47-1.12) | TKA:-Age: OR=0.99 (95% CI 0.98-1.02)-Sex: OR=1.09 (95% CI 0.76-1.56)-Low education level: OR=0.79 (95% CI 0.53-1.20)-Weak social support: OR=0.92 (95% CI 0.62-1.37) | -See variables in preceding box |
AKSS, American Knee Society Score; ASA, American Society of Anesthesiologists; BMI, body mass index; CI, confidence interval; COPD, chronic obstructive pulmonary disease; DM, diabetes mellitus; EQ5D, Euroqol 5 dimensions; H-ICDA, Mayo Clinic's Hospital adaptation of International Code for Diseases codes; HSQ, Health Status Questionnaire; ICD-9, International Classification of Diseases – ninth revision codes; IMD 2004, Index of Multiple Deprivation; KOOS, Knee Injury and Osteoarthritis Outcome Score; MPQ, McGill Pain Questionnaire; NS, not significant; NSAID, nonsteroidal anti-inflammatory drugs; OA, osteoarthritis; OAKHQOL, Osteoarthritis Knee and Hip Quality of Life questionnaire; OKS, Oxford Knee Score; OR, odds ratio; PCS, Pain Catastrophizing Scale; PHQ-9, Patient Health Questionnaire; postop, postoperative; preop, preoperative; PVD, peripheral vascular disease; RA, rheumatoid arthritis; RCT, randomized clinical trial; rehab, rehabilitation; SF-12, 12-Item Short Form Health Survey; SF-36, 36-Item Short Form Health Survey; SF-MPQ, Short Form McGill Pain Questionnaire; ST, Stair Test; THA, total hip arthroplasty; TKA, total knee arthroplasty; TSK, Tampa Scale for Kinesiophobia; TUG, Timed Up and Go Test; VAS, Visual Analog Scale; WHOQOL-BREF, World Health Organization Quality of Life BREF; WOMAC, Western Ontario McMasters University.
Studies Excluded and the Reasons for Their Exclusion.
| # | Study | Reasons for exclusion |
|---|---|---|
| 1 | Anakwe 2011 | Postop pain is not the dependent variable |
| 2 | Alzahrani 2011 | Postop pain is not the dependent variable |
| 3 | Anouchi 1996 | Postop pain is not the dependent variable |
| 4 | Arbuthnot 2011 | Postop pain is not the dependent variable |
| 5 | Ayers 2004 | Included in a systematic review |
| 6 | Ayers 2005 | Included in a systematic review |
| 7 | Bachmeier 2001 | Utilizes the SF-36 bodily pain subscale |
| 8 | Baker 2007 | Postop pain is not the dependent variable |
| 9 | Barrack 2000 | Certain variables are not evaluated as predictive factors; the text only establishes differences |
| 10 | Beaupre 2004 | Included in a systematic review |
| 11 | Brander 2003 | Included in a systematic review |
| 12 | Briton 1997 | Sex is not evaluated as a predictive factor; the text only establishes differences |
| 13 | Busato 2008 | Postop pain is not the dependent variable |
| 14 | Caracciolo 2005 | Postop pain is not the dependent variable |
| 15 | Carroll 2012 | There is a mix of different types of surgery; there is no subanalysis by group |
| 16 | Chalidis 2010 | The surgical technique is not evaluated as a predictive factor; the text only establishes differences |
| 17 | Cheng 2012 | Postop pain is not the dependent variable |
| 18 | Choi 2012 | Postop pain is not the dependent variable |
| 19 | Clement | Could not be found |
| 20 | Crosbie 2010 | The variables predictive of postop pain are not preop factors |
| 21 | D’Apuzzo 2012 | All the patients have fibromyalgia |
| 22 | Dickob 1996 | Certain variables are not evaluated as predictive factors; the text only establishes differences |
| 23 | Dowsey 2009 | Language is not evaluated as a predictive factor; the text only establishes differences |
| 24 | Fisher 2007 | Postop pain is not the dependent variable |
| 25 | Fitzgerald 2004 | Utilizes the SF-36 bodily pain subscale |
| 26 | Fortin 2002 | Postop pain is not the dependent variable |
| 27 | Gandhi 2009 | Postop pain is not the dependent variable |
| 28 | Hall 2002 | Postop pain refers to pain at hospital discharge |
| 29 | Hosaka 2011 | Postop pain is not the dependent variable |
| 30 | Kamath 2010 | Postop pain is not the dependent variable |
| 31 | Kennedy 2013a | Certain variables are not evaluated as predictive factors; the text only establishes differences |
| 32 | Kennedy 2013b | Certain variables are not evaluated as predictive factors; the text only establishes differences |
| 33 | Konig 1997 | Could not be found |
| 34 | Kostamo 2009 | Certain variables are not evaluated as predictive factors; the text only establishes differences |
| 35 | Kulkarni 2000 | Certain variables are not evaluated as predictive factors; the text only establishes differences |
| 36 | Lavernia 2011 | Sex is not evaluated as a predictive factor; the text only establishes differences |
| 37 | Lavernia 2009 | Could not be found |
| 38 | Lavernia 2013a | Could not be found |
| 39 | Lavernia 2013b | Could not be found |
| 40 | Lee 2011 | The surgeon's impression of the intervention is not evaluated as a predictive factor; the text only establishes differences |
| 41 | Liebs 2011 | Postop pain is not the dependent variable |
| 42 | Lingard 2004 | Could not be found |
| 43 | Lingard 2006 | Included in a systematic review |
| 44 | Lingard 2007 | Included in a systematic review |
| 45 | Lizaur-Utrilla 2012 | Included in a systematic review |
| 46 | Lopez-Olivo 2011 | Included in a systematic review |
| 47 | MacDonalds 2008 | Certain variables are not evaluated as predictive factors; the text only establishes differences |
| 48 | Mahomed 2002 | Included in a systematic review |
| 49 | Manion 2009 | Postop pain is not the dependent variable |
| 50 | Marti-Valls 2000 | Postop pain is not the dependent variable |
| 51 | Molli 2012 | Certain variables are not evaluated as predictive factors; the text only establishes differences |
| 52 | Munk 2011 | Postop pain is not the dependent variable |
| 53 | Nilsdotter 2001 | Certain variables are not evaluated as predictive factors; the text only establishes differences |
| 54 | Nilsdotter 2002 | Certain variables are not evaluated as predictive factors; the text only establishes differences |
| 55 | Rolfson 2009 | Included in a systematic review |
| 56 | Rooks 2006 | Certain variables are not evaluated as predictive factors; the text only establishes differences |
| 57 | Samson 2010 | Postop pain is not the dependent variable |
| 58 | Street 2005 | There is no adjusted analysis |
| 59 | Van Der Straeten 2013 | Postop pain is not the dependent variable |
Postop, postoperative; preop, preoperative.
Major Conclusions With Their Level of Evidence and Grade of Recommendation.*
| Conclusion | LE; GR |
|---|---|
| Advanced age, female sex are associated with greater postoperative pain | 2a; B |
| African American race and low socioeconomic status are associated with greater postoperative pain | 1b; A |
| The presence of greater preoperative pain is a highly robust independent predictor of postoperative pain | 2b; B |
| Poor preoperative functional status is a predictor of greater postoperative pain | 2c; B |
| High BMI may be associated with greater postoperative pain, especially in cases of morbid obesity | 2a; B |
| The presence of comorbidities is associated with greater postoperative pain, especially when there are several concomitant diseases | 1b; A |
| Psychological factors such as depression, anxiety and pain catastrophizing are strong predictors of greater postoperative pain | 1c; A |
BMI, body mass index; GR, grade of recommendation; LE, level of evidence.
With regard to the population, the great majority of the patients included had knee and hip OA and were over 60 years of age. We found a wide variability in the remaining characteristics of the patients, but it is noteworthy that in those for whom the BMI was recorded, it was high or very high, as was the mean number of comorbidities.
Some of the selected articles only evaluated the postoperative pain in patients who had undergone THA or TKA. There were also articles that included both procedures. It is important to point out that there was a wide variability when it came to measuring postoperative pain. Many of the studies utilized the Western Ontario and McMaster Universities Arthritis Index (WOMAC) or a self-reported pain system, but other forms of measuring postoperative pain were found, such as visual analog scales, indirect estimation by determining analgesic use, or quality of life questionnaires that included the pain dimension. We included scales such as the American Knee Society Score, which, in addition to pain, assesses function and range of motion, the Oxford Knee Score, a short questionnaire (12 items) based on patient responses, that is easy to employ. The Knee Injury and Osteoarthritis Outcome Score evaluates 5 dimensions: pain, symptoms, function in activities of daily living, function in sports and recreation and knee-related quality of life. The McGill Pain Questionnaire is based on the perception of pain as multidimensional: sensory/discriminative, affective/motivational and cognitive/evaluative. Other scales used, like the Osteoarthritis Knee and Hip Quality of Life questionnaire and the World Health Organization Quality of Life BREF, were based on the measurement of the quality of life of the patients.
Other available preoperative predictive variables included sociodemographic aspects (age, sex, level of education, socioeconomic status, race, etc.), clinical aspects (diagnosis, disease duration, preoperative pain, etc.), psychological aspects (anxiety, depression, expectations, coping skills, etc.) and aspects related to the hospital (which included the waiting list) and to the surgeon.
Sociodemographic predictive factorsAge: in general, an inverse association was observed between age and postoperative pain, which was greater among the youngest patients,14,17–21 although in 2 studies the association was direct.22,23 In neither case did the size of the effect appear to be very great. Nevertheless, the association between age and postoperative pain did not reach statistically significant values in some studies.21,24–30
Sex: in general, female sex was associated with more intense postoperative pain. The effect of sex on postoperative pain was quite consistent, being greater in women,20,23,24,29,31 although, in some studies, a differential effect was observed with respect to the site of the arthroplasty.14,20,25 It was not possible to show a statistically significant association between sex and postoperative pain in some studies.17,21,22,26,32 The size of the effect varied widely from one study to another.
Level of education: this was a controversial variable; it was not possible to draw a robust conclusion in this respect. The majority of the studies found no association16,17,28,33,34; only one article reported that the higher the level of education, the less intense the postoperative pain.35 Moreover, there was a wide variability in the definition of level of education depending on the country.
Socioeconomic status: being poor was associated with more intense postoperative pain, at least over the short term, in a number of studies.16,33 However, more studies and more homogeneous definitions would be necessary to enable the formulation of definitive recommendations.
Social support: this variable also proved to be controversial and, thus, a robust conclusion could not be drawn. In one article, the presence of social support was associated with less intense postoperative pain,19 but in another, weak social support was not associated with greater postoperative pain.34 As occurred in the case of the socioeconomic status, further research would be needed in this respect.
Preoperative educational interventions: these measures had no effect on postoperative pain.13 We should point out that this was the conclusion reached in a SR in which there were different interventions, some of which were offered just a few days prior to surgery. Thus, perhaps they were not effective because the patients did not have enough time to assimilate them properly.
Race: African-American race was associated with worse postoperative pain17,27 Although there were few studies on this aspect, the size of the effect appeared to be considerable and consistent, reaching a β coefficient=–9.5 (95% CI –16.9 to –2.1).
Clinical FactorsPreoperative pain: the level of preoperative pain maintained a linear and direct relationship (quite consistent) to postoperative pain.25,29–31,35 The size of this effect was variable, but tended to be moderate. However, in some studies, an inverse relationship was observed,28 and another revealed a differential effect depending on the length of follow-up, with an inverse relationship during the first 6 months and a direct relationship at 2 years.21 No statistically significant relationship was observed in one study.23
Body mass index: the findings were controversial. The relationship between BMI and postoperative pain was not clear in many cases. Some studies found an association, especially with high degrees of obesity (morbid obesity).9,20,22,36 According to multivariate analyses, the effect in these cases could come to be really important. The association of postoperative pain measured by the WOMAC in patients with BMI>35 who underwent THA was estimated to reach β coefficients of up to 5.91 and β coefficients=9.7 in those with this BMI who underwent TKA (95% CI 4.3–14.4). However, the association did not reach statistically significant values in numerous other studies.17,24,26,28,29,31,37
Comorbidity: it was not possible to establish very robust conclusions with respect to the predictive role of the presence of comorbidities. A relationship was observed between the number of chronic diseases and postoperative pain in several studies,19,26 in which, as occurred with BMI, there was an important effect on postoperative pain in those patients with the highest number of comorbidities. In multivariate analyses, for example, in relation to the postoperative pain measured by the WOMAC, patients with ≥2 comorbidities reached a β coefficient=6.50 (95% CI 2.00–11),19 but when measured in another study by the Health Status Questionnaire (HSQ), the β coefficient was=–4.6 (95% CI –7.5 to –1.7).27 It was also demonstrated that comorbidity could affect postoperative pain both at 3 years and at 10 years. However, the results contradicted those of another study25 and did not reach statistical significance in many others.16,21,22,30,36–38
Diagnosis: there were no differences between patients with OA and hip dysplasia17 in terms of postoperative pain; nevertheless, it was found that patients with RA experienced greater postoperative pain than those with OA.26 However, given that we searched expressly for articles in which the majority of the patients did not have an inflammatory disease, it was not possible to draw a conclusion in this respect.
Preoperative functional capacity: a poorer preoperative functional status was a predictor of greater postoperative pain.27,39 However, on the basis of findings published to date, the size of the effect was not large.
Low back pain: the preoperative presence of this condition was associated with worse postoperative pain,19,40 but there was not enough data to draw a robust conclusion. The effect of preoperative low back pain may have been an important factor in postoperative pain. In fact a β coefficient=–5.26 (95% CI –8.24 to –2.27) was reported.19,40
Psychological Predictive FactorsLevel of self-efficacy: the effect of this factor was indeterminate.15,41 Although there were high-quality articles that suggested that those patients with a higher level of preoperative self-efficacy had less intense postoperative pain,42 one SR failed to obtain clear findings and dismissed this aspect as indeterminate.15 The possibility that it be a modulator (of other psychological aspects of the patient and of pain), rather than a predictor in the strictest sense should be examined. This would indicate the need for further studies on interactions to evaluate its real effect on postoperative pain.
Patient expectations: as was the case in the preceding variable, its effect remained indeterminate.15,37,41 Again, although there were high-quality articles that suggested that the patients with higher preoperative expectations experienced less postoperative pain,43 the same SR15 concluded that its effect could not be determined. In this case, also, it is necessary to examine the possibility that it be a modulator (of other psychological aspects of the patient and of pain), rather than a predictor in the strictest sense.
Catastrophism (pain experience that focuses on and exaggerates excessively the feeling of pain, accompanied by the perception of being unable to control it): the preoperative presence of pain catastrophizing (catastrophism) was clearly associated with greater postoperative pain.15,37 The size of the effect was also important. Moreover, a behavioral intervention to deal with pain catastrophizing reduced postoperative pain.44
Depression and/or anxiety: their presence prior to surgery was associated with greater postoperative pain, a finding that was highly consistent, especially for depression,9,15,37,38,45 and in which there was also a substantial effect size.
Pessimistic explanatory style: it was not possible to determine its effect.15,46 Like other variables, it may be a modulating factor.
Worse preoperative mental health: a number of studies reported its association with greater postoperative pain,15,16,21 finding a substantial effect size.
Other psychological factors: many of the other psychological factors studied were found to have an indeterminate effect on postoperative pain.15
Surgery-related Predictive FactorsWaiting list: the longer the waiting list, the greater the postoperative pain, but this variable did not reach statistical significance for either THA or TKA.25 We should point out that the cited study was not carried out in Spain. Thus, the indication for surgery, criteria and timing may be different.
Pain did not appear to be related to questions of caseload, either of the surgeon or the hospital, but it did seem to be less intense when the surgeon was a certified orthopedist.47
DiscussionThis systematic review has enabled the identification of a large group of preoperative factors that have a significant effect on postoperative pain in patients in whom THA or TKA is indicated. The original idea behind the present study was to carry out a meta-analysis, but due to the extraordinary heterogeneity found, that proved to be impossible. However, the fact that studies were selected and the conclusions drawn on the basis of adjusted analyses enabled us to show the independent effect of each factor. This is highly valuable for decision-making in routine practice since, moreover, these factors were compiled from observational studies with populations similar to those encountered on a daily basis. The quantification of the exact effect sizes of these predictors would be of great utility.
It is surprising to see the large number of articles in which the objectives, title and conclusions refer literally to predictive factors, when what they really analyze are intergroup differences (crude data, which can vary when adjusted for cofactors). That is, the predictive value of a given variable is not evaluated robustly.48 On the other hand, many articles evaluate pain in the descriptive part, but in regression analyses evaluate only function. Moreover, despite the fact that multivariate analyses often include variables that could be subject to collinearity, this phenomenon is not taken into account.35 Finally, the approach to the measurement of the predictive variables is highly inconsistent, another circumstance that makes it difficult to generalize the results. Consequently, the conclusions of this review should be evaluated with care.
With respect to the predictive variables analyzed, some of the ones that should be taken into account when it comes to indicating hip or knee arthroplasty, like age, sex and socioeconomic status, are not modifiable (or very difficult to modify). Aside from the fact that these variables may, moreover, be associated with other important results, such as prosthesis survival or anesthetic risk, the effect on postoperative pain is a key factor, as one of the main reasons for indicating this procedure is to relieve pain. It is essential that orthopedic surgeons include these parameters, although they are not modifiable, and explain their effect on the expected results of the arthroplasty, when it comes to asking their patients on an individual basis for their consent to perform the intervention. The combination of several of these unmodifiable factors could be a motive for an eventual reevaluation of the indication for surgery.
On the other hand, there is another group of preoperative factors that can influence postoperative pain and that may be modifiable in some way. Surgeons should suggest interventions that make it possible to modify them whenever possible. Special attention should be given to those predictive factors with the greatest impact on postoperative pain and the widest margin for modification, provided this does not result in a negative impact on the arthroplasty in terms of time and/or costs or for the patients themselves.44,49
One predictive factor whose effect on postoperative pain is highly controversial is BMI. Depending on the study, it was9,20,22,36 or was not17,24,26,28,29,31,37 associated with greater postoperative pain. There is evidence that at least those patients with very high BMI (morbidly obese) do tend to present poorer postoperative results. Taking into account the fact that obesity can have a negative effect on other aspects, such as prosthesis survival, it seems appropriate to stress the need that the patients control overweight prior to surgery. With comorbidities, the situation is very much the same.19,26 Although many correspond to chronic and incurable conditions, the necessary control over medication and careful vigilance would probably have a positive influence on the outcome of the surgery.
Another of the modifiable factors is the preoperative pain.25,29–31,35 It is true that, in most cases, the failure of pain medications is precisely one of the main reasons for the indication for arthroplasty. In this respect, pain treatment should be aimed at reducing it to the greatest possible extent so that the patients feel greater comfort and better postoperative results can be obtained. Once arthroplasty has been indicated, the management of pain and of the loss of function in patients of this type is not over, and there should be an active search for interventions to target their pain. Among the factors of this type, we could include the presence of preoperative low back pain.19,40
In this review, the psychological factors appear as being among those that, in general, have the greatest influence on postoperative pain.9,15,37,38,45 Intervention on these psychological components can achieve their modification, although it may take more time and resources to accomplish this aim. Here we find depression, anxiety and the presence of pain catastrophizing. We should consider including at least an evaluation and a rapid and systematic detection of the presence of any of these conditions in the assessment of the candidate for THA or TKA, which would enable us to look for the best possible solution on an individual basis.
In conclusion, once the indication for THA and/or TKA is clear, it is essential to take into account certain preoperative variables that influence the outcome of the intervention as far as postoperative pain is concerned. Nonmodifiable variables, such as female sex, younger patient age, low socioeconomic status and the presence of comorbidities, should be taken into account when deciding on the indication for arthroplasty. Modifiable variables or those amenable to intervention, such as obesity, the presence of intense preoperative pain or severe functional impairment, and the existence of psychological disturbances, should be evaluated systematically to assess the performance of preoperative interventions that contribute to the achievement of better outcomes with THA and TKA.
Ethical DisclosuresProtection of human and animal subjectsThe authors declare that no experiments were performed on humans or animals for this study.
Confidentiality of dataThe authors declare that no patient data appear in this article.
Right to privacy and informed consentThe authors declare that no patient data appear in this article.
Conflicts of InterestJorge Díaz Heredia, Pablo Crespo, Clara Hernández and María Luisa Berraquero have received fees from MSD in payment for scientific work.
Miguel Ángel Ruiz Iban has received fees from Astelas, Bristol-Myers Squibb, Grunenthal, MSD, Pfizer and Zambón in payment for teaching activities, as consultancy fees or as funding for research projects.
Estíbaliz Loza declares no conflicts of interest.
FundingThe present article was funded by MSD. MSD did not participate in choosing the subject, in the development of the review or the conclusions, or in the writing of the article.
The authors thank Eduardo Junco for his contribution to the development of the systematic review.
Additional material associated with this article can be found in the online version at http://dx.doi.org/10.1016/j.reumae.2014.12.011.
The following are the supplementary data to this article:

Please cite this article as: Hernández C, Díaz-Heredia J, Berraquero ML, Crespo P, Loza E, Ruiz Ibán MÁ. Factores predictores prequirúrgicos de dolor posquirúrgico en pacientes sometidos a artroplastia de cadera o rodilla. Una revisión sistemática. Reumatol Clin. 2015;11:361–380.


