

Hemogram parameters have been recently proposed as markers of inflammation in various studies from different parts of the world. Two of these hemogram parameters are red cell distribution width (RDW) and mean platelet volume (MPV).
AimTo evaluate the relation between RDW and MPV with disease activity of rheumatoid arthritis. To assess whether RDW and MPV can be used to follow disease activity in RA patients.
MethodsThis is an observational cross-sectional study that was carried out on 60 rheumatoid arthritis patients who fulfilled the ACR/EULAR2010 classification criteria of RA attending to Rheumatology and Rehabilitation inpatient and outpatient clinics at Zagazig University Hospitals. All cases were subjected to full history taking, clinical examination, and laboratory investigations; differential complete blood picture (CBC), acute phase reactants (CRP and ESR), rheumatoid factor (RF) and anti-cyclic-citrullinated peptide (anti-CCP) antibodies. Disease activity was measured by disease activity score 28 (DAS28).
ResultsThe cut-off levels of RDW and MPV were 14.85 and 11.25. Patients with RDW>14.85 had higher Disease Activity Score 28 (DAS28; p=0.0003), ESR (p=0.0001) and CRP (p=0.0001). RDW was positively correlated with disease activity markers (ESR, CRP and DAS28) in rheumatoid arthritis patients. But, DAS28 was not different between patients with MPV>11.25 and <11.25.
ConclusionRDW was strongly correlated with disease activity. Also, RDW was better than ESR and CRP in detecting RA disease activity. According to these findings we suggest that RDW can be used in clinics to follow disease activity. In addition, RDW is widely available; as it's usually included in routine complete blood picture and there will be no need for further cost.
Los parámetros del hemograma se han propuesto recientemente como marcadores de inflamación en varios estudios de diferentes partes del mundo. Dos de estos parámetros del hemograma son el ancho de distribución de glóbulos rojos (RDW) y el volumen plaquetario medio (MPV).
ObjetivoEvaluar la relación entre RDW y MPV con la actividad de la enfermedad de la artritis reumatoide (AR). Evaluar si RDW y MPV se pueden utilizar para seguir la actividad de la enfermedad en pacientes con AR.
MétodosSe trata de un estudio transversal observacional que se llevó a cabo en 60 pacientes con AR que cumplieron con los criterios de clasificación ACR/EULAR2010 de AR que acudieron a consultas hospitalarias y ambulatorias de reumatología y rehabilitación en los Hospitales Universitarios de Zagazig. Todos los casos fueron sometidos a una anamnesis completa, un examen clínico e investigaciones de laboratorio; imagen diferencial arterial completa, reactivos de fase aguda (CRP y ESR), factor reumatoide y anticuerpos antipéptido cíclico-citrulinado. La actividad de la enfermedad se midió mediante la puntuación de actividad de la enfermedad 28 (DAS28).
ResultadosLos niveles de corte de RDW y MPV fueron 14,85 y 11,25. Los pacientes con RDW>14,85 tenían mayor puntuación de DAS28 (p=0,0003), ESR (p=0,0001) y CRP (p=0,0001). RDW se correlacionó positivamente con marcadores de actividad de la enfermedad (ESR, CRP y DAS28) en pacientes con AR. Sin embargo, DAS28 no era diferente entre los pacientes con MPV>11,25 y <11,25.
ConclusiónRDW estaba fuertemente correlacionado con la actividad de la enfermedad. Además, RDW fue mejor que ESR y CRP en la detección de la actividad de la enfermedad de AR. De acuerdo con estos hallazgos, sugerimos que el RDW se puede utilizar en clínicas para seguir la actividad de la enfermedad. Además, RDW está ampliamente disponible, ya que por lo general se incluye en la imagen de sangre completa de rutina y no habrá necesidad de costos adicionales.
Rheumatoid arthritis (RA) is a chronic systemic autoimmune disease that primarily affects the lining of the synovial joints and is associated with progressive disability, premature death, and socioeconomic burdens.1 RA affects 0.5–1% of adult population. The disease affects women three times more than men.2 RA diagnostic criteria and regular follow up are mainly based on clinical manifestations, laboratory tests, and imaging studies. Laboratory tests include autoantibodies and inflammatory markers; such as anti-cyclic citrullinated peptide antibodies (ACPAs), rheumatoid factor (RF), C-reactive protein (CRP), erythrocyte sedimentation rate (ESR), and others.3
Hemogram parameters have been recently proposed as markers of inflammation in various studies from different parts of the world. Beside their importance in homeostasis, authors have implied them to reflect the inflammatory burden. Two of these hemogram parameters are red cell distribution width (RDW) and mean platelet volume (MPV).4
RDW is a parameter included in the hemogram with automatic analyzers that reflects the variation in the volume and size of RBCs. Many reports suggest that RDW may be indicative of a person's underlying general health status, and more specifically may reflect the degree of inflammation an individual may possess. The different factors that might increase the heterogeneity in size, such as the red blood cell circulation half-life and membrane deformability, can be influenced by inflammation too.5 Any process that releases reticulocytes in the circulation will result in an increase in RDW.6 RDW has also been linked to single and multiple organ dysfunction reflecting the degree of anisocytosis in many disorders such as cardiac disease, venous thromboembolism, malignancy, diabetes mellitus, pulmonary disease, liver and kidney failure. Also, RDW is thought as an independent risk factor for mortality. However, in RA we do not know if an increased value of RDW is a risk factor or should only be considered an epiphenomenon of an underlying biological and metabolic imbalance involving both impaired erythropoiesis and abnormal red blood cell survival.7–11 Hence, it could be increased in autoimmune diseases and was found in some studies related to disease activity or its complications. It is now reasonable to suggest RDW as a potential biomarker similar to C-reactive protein (CPR) or erythrocyte sedimentation rate (ESR).12
MPV reflects the rate of platelet production in the bone marrow and the platelet size in circulation, and it may be used as an indicator of platelet activation and the severity of inflammation. MPV has been studied as an indicator of disease activity in various inflammatory conditions.13 Platelet receptors such as CD40, GPIb/IX/V, and selectins have all been implicated in perpetuation of atherosclerosis, rheumatoid arthritis (RA), and tumors.14 In autoimmune diseases such as systemic lupus erythematosus (SLE), immune complexes activate platelets by interacting with Fc receptors; in RA, the platelet is a well-known source of prostaglandins within the inflamed synovium. IL-1-containing platelet-derived vesicles are abundant in synovial fluid and stimulate synovial fibroblast to produce inflammatory mediators. Moreover, serotonin released by platelets enhances vascular permeability within the inflamed synovium.15
The association of RDW and MPV with clinical disease activity indices of RA has not yet been established. Literatures are full of data about the association of inflammation with RDW and also MPV. Although they are both inexpensive and easy to use, clinical usefulness of these parameters is still controversial and results of different studies about MPV levels in various inflammatory diseases are incompatible.4,16 So, the present study aimed to indicate RDW and MPV levels in RA patients, and to study their association with the clinical disease activity indices.
Materials and methodsStudy design and subjectsThis cross-sectional study was carried out in Rheumatology and Rehabilitation inpatient and outpatient clinics at Zagazig University Hospitals. The sample was calculated to be 60 rheumatoid arthritis patients. Patients enrolled fulfilled the ACR/EULAR2010 classification criteria of RA.17 Exclusion criteria included patients diagnosed with other rheumatologic diseases, malignancy, endocrinal diseases or blood disorders that affect RDW and MPV. The study followed the principles of the Helsinki Declaration and ethical approval was received from the Institutional Review Board (IRB) of Zagazig University.
Clinical and laboratory measuresFull history taking and thorough clinical examination was performed to all patients. Current disease activity was assessed using Disease Activity Score 28 (DAS 28).18 Laboratory investigations were recorded including Complete blood picture (CBC) including differential cell count, C-reactive protein (CRP), erythrocyte sedimentation rate (ESR), hemoglobin, rheumatoid factor (RF) and antibodies to cyclic citrullinated peptide (anti-CCP).
Statistical methodsAll data were collected, tabulated and statistically analyzed using SPSS IBM Corp. Released 2015. IBM SPSS Statistics for Windows, Version 23.0. Armonk, NY: IBM Corp. T-test was used to compare between two groups of normally distributed variable. Mann–Whitney U test was used to compare between two groups of non normally distributed variable percent of categorical variables were compared using Chi-square test or fisher Exact test when appropriate. Spearman's correlation coefficient was calculated to assess relationship between various study variables. Sensitivity, specificity and cut-off value were determined by using the receiver operating characteristic (ROC) curve.
ResultsDemographic, clinical & laboratory characteristics of RA patientsTable 1 shows the demographic, clinical and laboratory characteristics of RA patients. Mean age was 50.6±8.8.
Demographic data, disease characteristics and laboratory findings of Rheumatoid arthritis patients (n=60).
| Variables | Mean±SD | |
|---|---|---|
| Age per years | 50.6±8.8 | |
| Sex | No | % |
| Female | 52 | 86.7 |
| Male | 8 | 13.3 |
| Smoking | No | % |
| Smokers | 4 | 6.7 |
| Ex-smokers | 10 | 16.7 |
| Non smokers | 46 | 76.6 |
| Median (range) | ||
| BMI | 29.5 (20.5–38.9) | |
| Disease duration (years) | 17 (2–38) | |
| Morning stiffness (minutes) | 97.5 (15–180) | |
| Number of tender joints | 14 (1–28) | |
| Number of swollen joint | 7 (1–14) | |
| Visual analog scale (0–100mm) | 54.5 (0–95) | |
| DAS28 | 3.35 (1.1–6.2) | |
| Mean±SD | ||
| WBC (10^3/μl) | 7.1±1.5 | |
| HGB (g/dl) | 12.4±1.2 | |
| MCV (fl) | 100.6±13.7 | |
| PLT (10^3/μl) | 283.3±82 | |
| RDW (%) | 15.3±1.8 | |
| MPV (fl) | 10.8±0.82 | |
| Median (range) | ||
| ESR (mm/h) | 27.4 (2.1–55.6) | |
| CRP (mg/l) | 11.1 (1.1–28.8) | |
| Anti-CCP | No | % |
| Negative | 48 | 80 |
| Positive | 12 | 20 |
BMI: body mass index; CRP: C-reactive protein; ESR: erythrocyte sedimentation rate; HGB: hemoglobin; MCV: mean corpuscular volume; MPV: mean platelet volume; PLT: platelet; RDW: red cell distribution width; WBC: white blood cell; DAS28: disease activity score 28; anti-CCP: anti-cyclic citrullinated peptides.
Table 2 shows direct significant correlation between RDW (%) of studied rheumatoid arthritis patients and their DAS28score, ESR (mm/h) and CRP (mg/l). The current table shows statistically insignificant correlation between MPV (%) of studied rheumatoid arthritis patients and their demographic, disease characteristics and laboratory finding.
Correlations between RDW (%) and MPV and demographic, disease characteristics and laboratory findings.
| RDW (%) | MPV (fl) | |||
|---|---|---|---|---|
| r | p | r | p | |
| Age | 0.081 | 0.539 | −0.160 | 0.221 |
| BMI | −0.028 | 0.829 | 0.179 | 0.172 |
| Disease duration (years) | −0.069 | 0.603 | −0.016 | 0.905 |
| Morning stiffness (minutes) | 0.002 | 0.988 | −0.07 | 0.593 |
| Number of tender joints | 0.159 | 0.225 | 0.105 | 0.424 |
| Number of swollen joint | −0.029 | 0.828 | −0.077 | 0.559 |
| Visual analog scale (0–100mm) | 0.23 | 0.077 | −0.028 | 0.831 |
| DAS28 | 0.508** | 0.0001 | 0.014 | 0.917 |
| ESR (mm/h) | 0.603** | 0.0001 | 0.015 | 0.91 |
| CRP (mg/l) | 0.590** | 0.0001 | −0.193 | 0.139 |
| WBC (10^3/μl) | 0.092 | 0.485 | 0.132 | 0.314 |
| HGB (g/dl) | 0.211 | 0.105 | −0.179 | 0.171 |
| MCV (fl) | 0.155 | 0.237 | 0.008 | 0.953 |
| PLT (10^3/μl) | 0.218 | 0.094 | −0.104 | 0.43 |
(r) Correlation coefficient, ** Significant p<0.01; BMI: body mass index; CRP: C-reactive protein; ESR: erythrocyte sedimentation rate; HGB: hemoglobin; MCV: mean corpuscular volume; MPV: mean platelet volume; PLT: platelet; RDW: red cell distribution width; WBC: white blood cell; DAS28: disease activity score 28; anti-CCP: anti-cyclic citrullinated peptides.
Table 3 shows that RA patients with RDW levels higher than 14.85 had statistically significant higher disease activity scores. However Table 4 shows that there was no significant differences between patients with MPV levels higher or lower than 10.4 in terms of clinical findings.
Comparison of RA patients according to RDW (%) levels.
| RDW (%) | t | p | ||
|---|---|---|---|---|
| ≥14.85(n=37) | <14.85(n=23) | |||
| Age | 52.3±7.3 | 47.8±10.4 | 1.94 | 0.057 |
| Sex n (%) | ||||
| Female | 32 (86.5) | 20 (87.0) | f | 0.99 |
| Male | 5 (13.5) | 3 (13.0) | ||
| Smoking n (%) | ||||
| Smokers | 2 (5.4) | 2 (8.7) | 0.28 | 0.87 |
| Ex-smokers | 6 (16.2) | 4 (17.4) | ||
| Non smokers | 29 (78.4) | 17 (73.9) | ||
| BMI | 29.4±4.6 | 29.8±5.7 | 0.29 | 0.77 |
| Disease duration (years) | 19 (2–33) | 16 (6–38) | U=.16 | 0.873 |
| Morning stiffness (minutes) | 105 (15–180) | 95 (15–180) | U=.11 | 0.909 |
| Number of tender joints | 14 (2–28) | 14 (1–24) | U=.88 | 0.377 |
| Number of swollen joint | 6 (1–14) | 8 (2–14) | U=1.5 | 0.133 |
| Visual analog scale (0–100mm) | 59 (0–95) | 37 (0–95) | U=1.8 | 0.067 |
| DAS28 | 3.8 (2.1–6.2) | 2.7 (1.1–5.6) | U=3.6 | 0.0003(S) |
| ESR | 35.4 (2–55.6) | 14.9(2.7–43.3) | U=4.2 | 0.0001(S) |
| CRP | 17.9(1.6–8.8) | 3.1 (1.1–17.4) | U=4.4 | 0.0001(S) |
| WBC (10^3/μl) | 7.1±1.6 | 7±1.5 | 0.28 | 0.78 |
| HGB (g/dl) | 12.7±1.2 | 12±1.03 | 1.2 | 0.025(S) |
| MCV (fl) | 101.5±13.9 | 99.2±13.6 | 0.64 | 0.53 |
| PLT (10^3/μl) | 290.9±86.5 | 271±74.3 | 0.92 | 0.36 |
| Anti-CCP n(%) | ||||
| Negative | 27 (73.0) | 21 (91.3) | f | 0.11 |
| Positive | 10 (27) | 2 (8.7) | ||
t=Student t-test, U=Mann–Whitney U test, f=Fisher Exact test, χ2 chi square test of significant, s=significant p<0.05, P>0.05 insignificant. BMI: body mass index; CRP: C-reactive protein; ESR: erythrocyte sedimentation rate; HGB: hemoglobin; MCV: mean corpuscular volume; MPV: mean platelet volume; PLT: platelet; RDW: red cell distribution width; WBC: white blood cell; DAS28: disease activity score 28; anti-CCP: anti-cyclic citrullinated peptides.
Comparisons of RA patients according to MPV levels.
| MPV (fl) | t | p | ||
|---|---|---|---|---|
| ≤11.25N=38 | >11.25N=22 | |||
| Age | 51.4±8.9 | 49.2±8.6 | 0.93 | 0.36 |
| Sex n (%) | ||||
| Female | 32 (84.2) | 20 (90.9) | f | 0.69 |
| Male | 6 (15.8) | 2 (9.1) | ||
| Smoking n (%) | ||||
| Smokers | 3 (7.9) | 1 (4.5) | χ2=1.1 | 0.58 |
| Ex-smokers | 5 (13.2) | 5 (22.8) | ||
| Non smokers | 30 (78.9) | 16 (72.7) | ||
| BMI | 29±5.3 | 30.6±4.3 | 1.2 | 0.25 |
| Disease duration (years) | 19 (2–38) | 16 (6–33) | U=.177 | 0.860 |
| Morning stiffness (minutes) | 105 (15–175) | 92.5 (15–180) | U=.292 | 0.770 |
| Number of tender joints | 12.5 (1–26) | 16.5 (5–28) | U=1.176 | 0.240 |
| Number of swollen joint | 8 (1–14) | 6 (1–10) | U=1.18 | 0.237 |
| Visual analog scale (0–100mm) | 54.5 (0–95) | 53.5 (0–95) | U=47 | 0.634 |
| DAS28 | 3.2 (1.2–6.2) | 3.6 (1.1–6.2) | U=.31 | 0.759 |
| ESR | 25.5 (2.7–55.6) | 29.25 (2.1–55.1) | U=.736 | 0.462 |
| CRP | 13.45 (1.1–28.8) | 10.3 (1.6–27.1) | U=.47 | 0.634 |
| WBC (10^3/μl) | 6.8±1.6 | 7.5±1.4 | 1.8 | 0.08 |
| HGB (g/dl) | 12.6±1.1 | 12.2±1.3 | 1.4 | 0.17 |
| MCV (fl) | 99.9±13.3 | 102.±14.6 | 0.58 | 0.56 |
| PLT (10^3/μl) | 287±86 | 276.5±76 | 0.48 | 0.63 |
| Anti-CCP n (%) | ||||
| Negative | 31 (81.6) | 17 (77.3) | f | 0.74 |
| Positive | 7 (18.4) | 5 (22.7) | ||
t=Student t-test, U=Mann–Whitney U test, f=Fisher Exact test, χ2 chi square test of significant, s=significant p<0.05, p>0.05 insignificant. BMI: body mass index; CRP: C-reactive protein; ESR: erythrocyte sedimentation rate; HGB: hemoglobin; MCV: mean corpuscular volume; MPV: mean platelet volume; PLT: platelet; MPV: mean corpuscular volume; WBC: white blood cell; DAS28: disease activity score 28; anti-CCP: anti-cyclic citrullinated peptides.
Fig. 1A shows ROC curve to discriminate moderately to severely active from mildly active (RA) with an (AUC) 0.82, 0.71, 0.69 for RDW (%), ESR, CRP respectively. So RDW (%) is good to discriminate moderately to severely active from mildly active (RA) then ESR followed by CRP. Fig. 1B shows ROC curve to discriminate moderately to severely active from mildly active (RA) with an (AUC) 0.53 for MPV. So MPV fails to discriminate moderately to severely active from mildly active (RA).
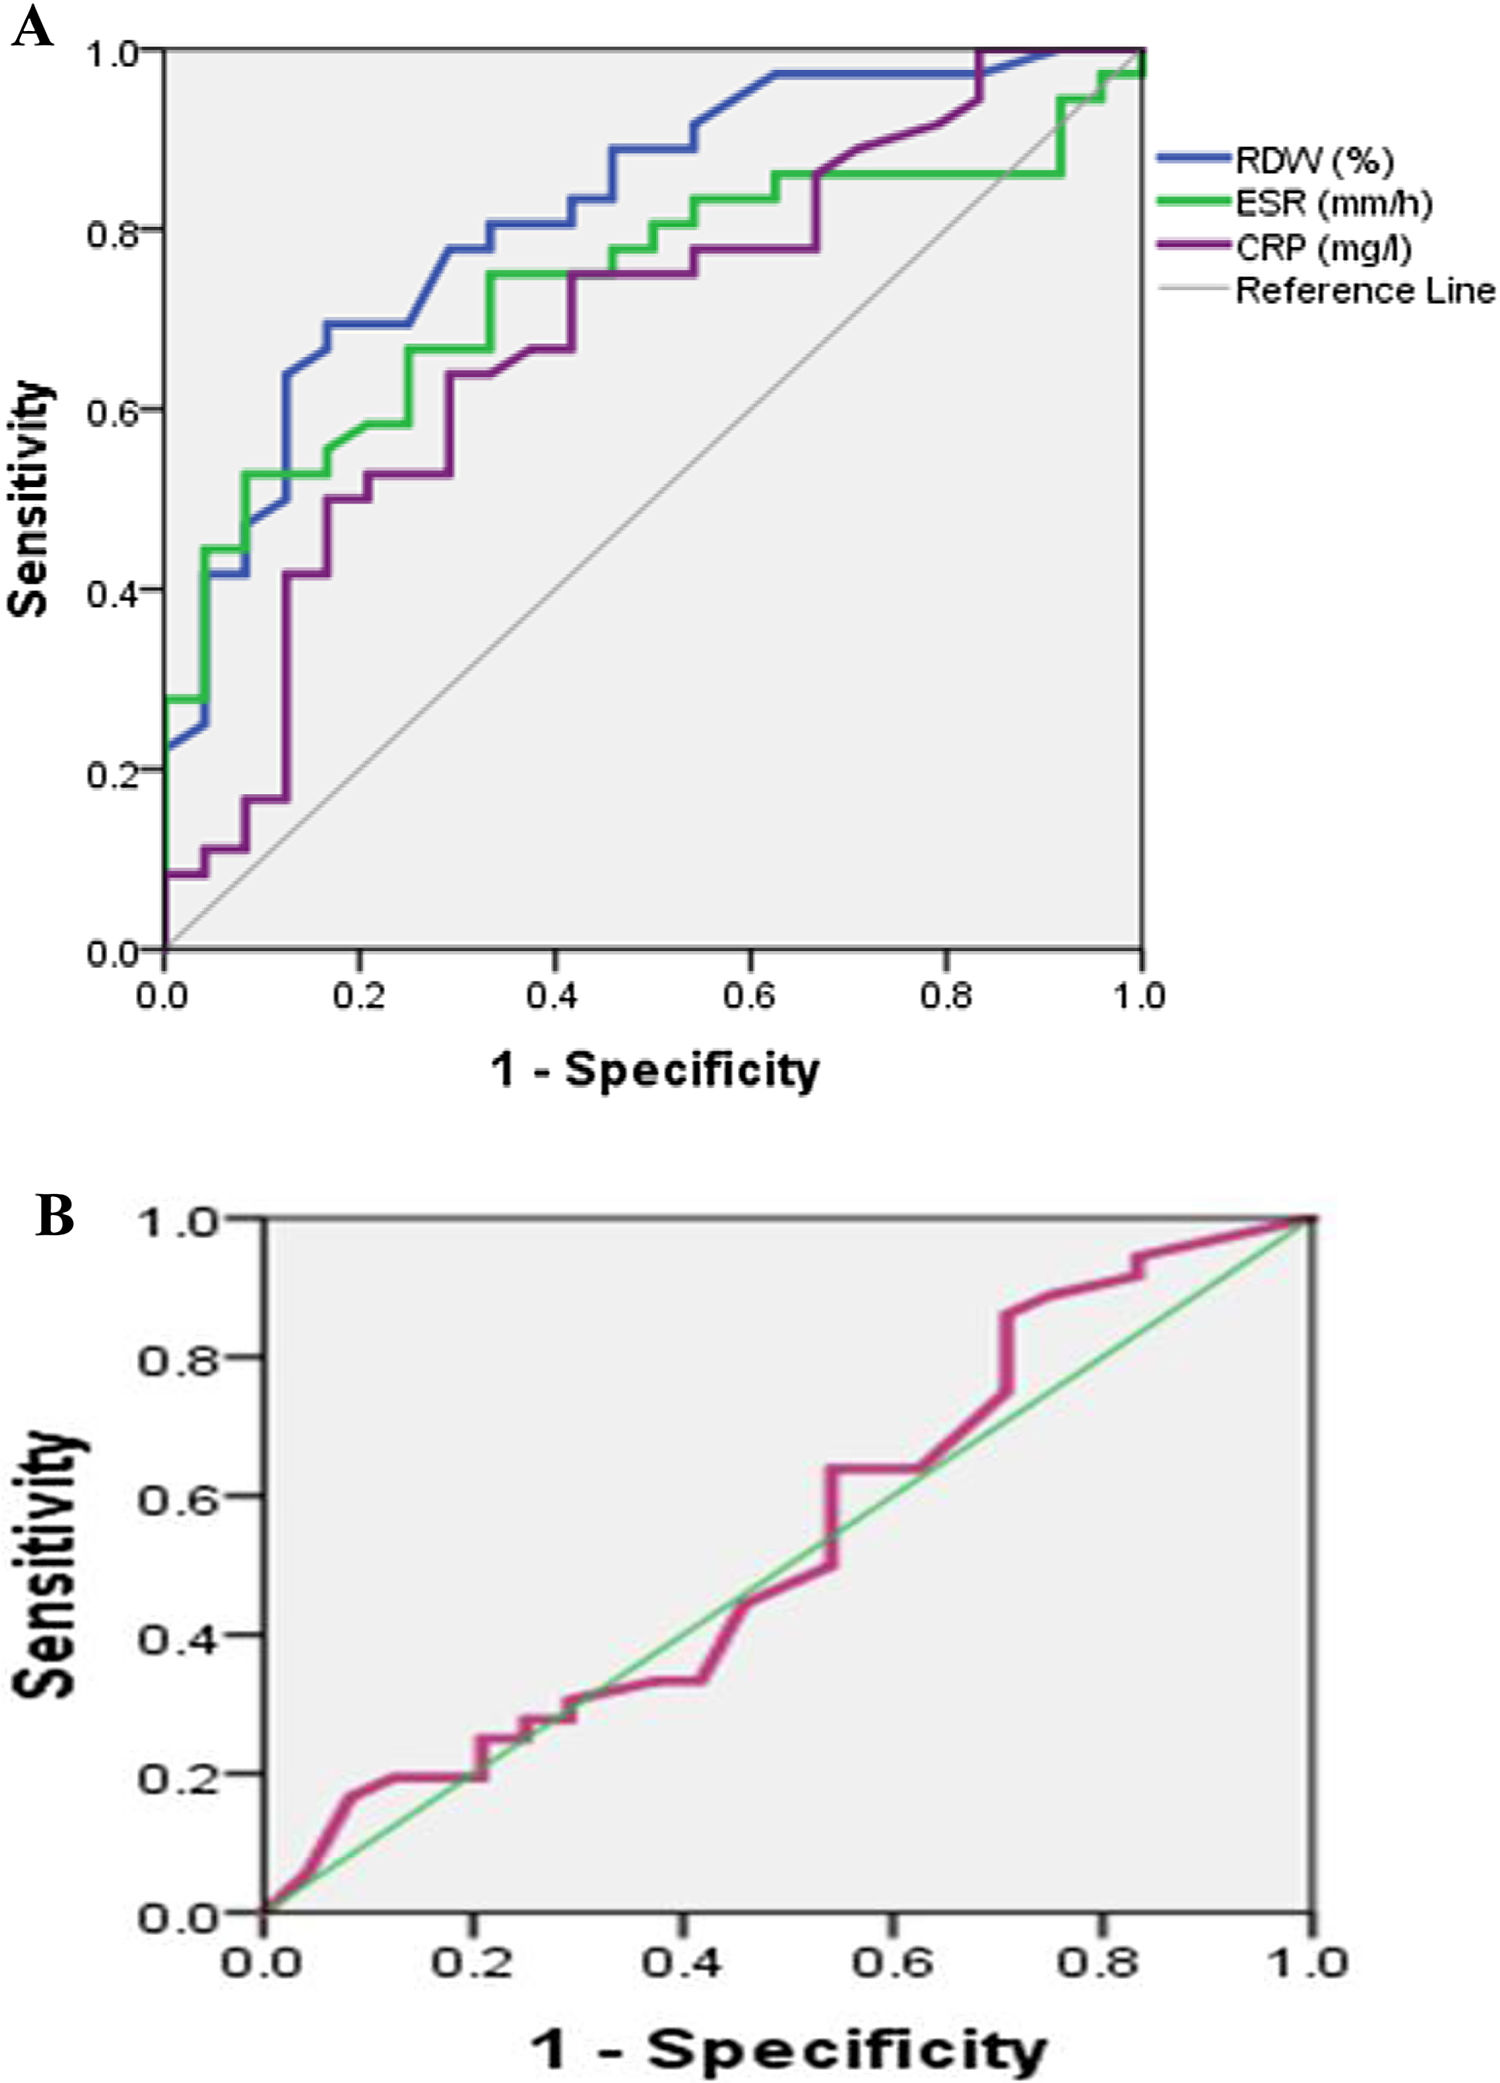
Table 5 shows the cutoff of RDW level was 14.8 (sensitivity 80.6%; specificity 66.7%; AUC: 0.82 and p<0.05). The cutoff of MPV level was 11.25 (sensitivity 63.9%; specificity 37.5%; AUC: 0.53 and p>0.05).
Validity data of RDW (%), ESR, CRP as marker to detect activity of Rheumatoid arthritis among patients (n=60).
| AUC | Cut off | p | DAS28 | Sens | Spec | PPV | NPV | Acc | ||
|---|---|---|---|---|---|---|---|---|---|---|
| Severe & moderate | Low | |||||||||
| RDW | 0.82 | ≥14.85 | 0.0001 | 29 | 8 | 80.6% | 66.7% | 78.4 | 69.6 | 75.0% |
| (%) | (0.71–0.93) | <14.85 | 7 | 16 | ||||||
| MPV | 0.53 | ≤11.25 | 0.67 | 23 | 15 | 63.9% | 37.5% | 60.5 | 40.9 | 53.3% |
| (fl) | (0.38–0.69) | >11.25 | 13 | 9 | ||||||
| ESR | 0.71 | ≥23.35 | 0.007 | 27 | 8 | 75.0% | 66.7% | 77.1 | 64.0 | 71.7% |
| (0.58–0.84) | <13.35 | 9 | 16 | |||||||
| CRP | 0.69 | ≥10.3 | 0.015 | 24 | 9 | 66.7% | 62.5% | 72.7 | 55.6 | 65.0% |
| (0.55–0.83) | <10.3 | 12 | 15 | |||||||
CRP: C-reactive protein; ESR: erythrocyte sedimentation rate; RDW: red cell distribution width; MPV: mean platelet volume, DAS28: disease activity score 28; AUC: area under curve; Sens: sensitivity, Spec: specificity, PPV: positive predictive value; NPV: negative predictive value, Acc: accuracy.
Table 6 shows the differences in mean RDW % and MPV regarding different comorbidities and medications. Anemia, anemia of chronic disease and iron deficiency anemia, significantly increased RDW %. Hepatic disease also increased RDW % (p<0.01). However, MPV seemed to be less influenced by these comorbidities. None of our patients had renal disease, cancer nor thromboembolism. In our RA patients, the use of different medications did not significantly influence RDW and MPV (p>0.05). None received cyclophosphamide, biological treatment nor biosimilars.
Variation in RDW and MPV with different comorbidities and medications.
| RA patients (n=60) | RDW % (Mean±SD) | MPV (fl) (Mean±SD) |
|---|---|---|
| Comorbidities | ||
| Anemia of chronic disease | ||
| Yes (n=5) | 17.74±0.44 | 11.24±0.63 |
| No (n=55) | 15.12±1.68 | 10.77±0.83 |
| t=3.45, p=0.001** | t=1.23, p=0.226 | |
| Iron deficiency anemia | ||
| Yes (n=7) | 17.74±0.44 | 11.24±0.63 |
| No (n=53) | 15.19±1.68 | 10.77±0.83 |
| t=4.036, p=0.000** | t=0.155, p=0.878 | |
| Megaloblastic anemia | ||
| Yes (n=13) | 15.57±1.97 | 10.92±0.78 |
| No (n=47) | 15.27±1.73 | 10.78±0.84 |
| t=0.532, p=0.597 | t=0.512, p=0.611 | |
| Hepatic disease | ||
| Yes (n=3) | 17.67±0.49 | 11.5±0.62 |
| No (n=57) | 15.21±1.73 | 10.78±0.8 |
| t=2.43, p=0.018* | t=1.51, p=0.137 | |
| Diabetes | ||
| Yes (n=7) | 16.19±2.04 | 10.71±0.59 |
| No (n=53) | 15.22±1.72 | 10.82±0.85 |
| t=1.359, p=0.179 | t=−0.332, p=0.741 | |
| Medications | ||
| NSAIDS | ||
| Yes (n=19) | 15.37±1.62 | 10.69±0.89 |
| No (n=41) | 15.32±1.86 | 10.96±0.75 |
| t=0.109, p=0.913 | t=−1.569, p=0.134 | |
| Steroids | ||
| Yes (n=31) | 15.26±1.74 | 10.94±0.77 |
| No (n=29) | 15.42±1.83 | 10.68±0.86 |
| t=−0.338, p=0.736 | t=1.214, p=0.230 | |
| Methotrexate | ||
| Yes (n=26) | 15.41±1.69 | 10.98±0.72 |
| No (n=34) | 15.28±1.86 | 10.68±0.88 |
| t=0.269, p=0.789 | t=1.441, p=0.155 | |
| Leflunomide | ||
| Yes (n=31) | 15.05±1.77 | 11.06±0.86 |
| No (n=29) | 15.64±1.75 | 11.04±0.72 |
| t=−1.296, p=0.2 | t=0.155, p=0.878 | |
| Antimalarial | ||
| Yes (n=39) | 15.24±1.8 | 10.84±0.87 |
| No (n=21) | 15.52±1.74 | 10.77±0.74 |
| t=−0.582, p=0.563 | t=0.309, p=0.758 | |
None of our patients had renal disease, cancer nor thromboembolism, also, none received cyclophosphamide, biological treatment nor biosimilars. t Student's T test.
RA is an autoimmune chronic disease which is usually accompanied with anemia, which may increase RDW.19 However, RDW was significantly higher in non-anemic RA patients. This suggests that RDW may also be affected by inflammation, not only anemia. MPV has also been studied as a marker of disease activity in various inflammatory conditions.13
In this study, we investigated the association between RDW and disease activity in 60 patients with RA. In our study, RDW values positively correlated with DAS28, ESR and CRP. These findings were in agreement with Tecer et al.16 who also found significant correlation between RDW and DAS28. Also, in agreement with Lippi et al.,20 in a large cohort study in 2009, who demonstrated a strong and graded association of RDW with CRP and ESR. In 2010 these findings were confirmed by another cohort study by Lee and Kim.21 Our results were also similar to Calabria et al.22 who found direct association between RDW and CRP, ESR and DAS28. These findings also agree with a more recent study by Hassan et al.,23 who found a significant correlation between RDW and disease activity markers suggesting the usefulness of using RDW to reflect disease activity.
On the other hand, in this study we found no significant correlation between MPV and any of disease activity markers (DAS28, ESR or CRP). These findings agree with the findings of Tecer et al.16 and Moghimi et al.24 Also, these findings agree with a more recent study of Hassan et al.,22 revealing the non-usefulness of MPV as disease activity marker. In contrast to our findings Yazici et al.25 found significant correlation between MPV and ESR, CRP and DAS28. This discrepancy may be due to difference in number of sample size used in both studies.
We found that AUC of RDW, specifically sensitivity and specificity was better than ESR and CRP to assess disease activity. As consistent with our results, Song et al. found that the diagnostic accuracy of RDW was superior to the CRP and ESR levels.26 Although, Tecer et al.16 found that AUC of RDW, namely sensitivity and specificity, was similar to ESR, but better than CRP to indicate of disease activity. We also found that AUC of MPV was less than ESR and CRP and these findings disagree with Tecer et al.16 in which AUC of MPV similar to ESR and CRP.
In our work, we further studied the influence of various comorbidities and the use of different medications on both RDW and MPV. RDW has long been used to differentiate the etiology of anemia, and it is easy to measure and cost-effective.27 In our studied RA patients, we found that anemia of chronic disease and iron deficiency anemia, but not megaloblastic anemia, significantly influenced RDW. Whilst, it did not significantly influence MPV. It is well known that anemia of chronic disease correlates with disease activity, and also more use of NSAIDS due to disease activity may be related to more iron deficiency anemia, so to consider the influence of anemia part of the theories by which RDW may be influenced in RA patients make us not looking it as a confounding point against its use to monitor disease activity, whether influenced directly by inflammation or indirectly by anemia as a complication of activity. The fact that inflammation prevents erythrocyte maturation by inhibiting iron metabolism and the response to erythropoietin, supports the indirect role of anemia leading to an increase in RDW during inflammation.27
RDW is increased in various liver diseases, including hepatitis, alcoholic liver cirrhosis, biliary cirrhosis, and liver cancer.28–30 Hepatic dysfunction in our patients was associated with increased RDW. However, other comorbidities discussed in our study like diabetes did not significantly affect neither RDW nor MPV. Although in another study, RDW was significantly and positively associated with HbA1c, corresponding an increase in HbA1c of 0.10% per 1 SD increase in RDW.31 According to our results, the use of different medications did not significantly influence RDW, nor did it affect MPV in this studied population. Although methotrexate is well known to affect folic acid metabolism, in our studied sample methotrexate did not influence RDW nor did megaloblastic anemia. None of our patients received biological therapy, but in some studies Anti-TNFa therapy resulted in a significant increase in MPV over the duration of the study.32
The main limitation in our work was being a single-center study, further larger multi-centered studies may be more beneficial. Moreover, prospective studies may be required to test its sensitivity to change over the time. We also recommend that RDW should be tested more widely in other rheumatologic diseases such as systemic lupus and systemic sclerosis to depict its value being a marker of single and multiple organ failure.
We finally conclude that RDW was strongly correlated with disease activity and was superior to ESR and CRP in detecting RA disease activity. According to these findings we suggest that RDW can be used in clinics as a disease activity marker. Whether replacing or in conjugation with other acute phase reactants is still controversial due to the presence of other factors influencing RDW like anemia and liver disease. In addition, RDW is widely available as it is usually included in routine complete blood picture and there will be no need for further cost. Unfortunately, MPV was not found to be a promising marker of activity in our study.
FundingNo funds, No grants.
Conflict of interestNone to declare.


