In March 2008, FRAX, developed by Kanis and collaborators in the University of Sheffield and supported by the World Health Organization, became available online to calculate absolute risk of osteoporotic fracture in the next 10 years.
ObjectiveTo analyze the risk of fracture calculated by FRAX and its determinants in the patients sent to a densitometry unit for bone mineral density (BMD) testing.
MethodsAll the patients submitted by Primary Care to the Densitometry Unit for BMD testing underwent a self administered questionnaire to assess the clinical risk factors included in FRAX and a bone densitometry of lumbar spine and proximal femur with a DXA densitometer Hologic QDR 4500. They were classified as having a normal BMD, osteopenia or osteoporosis along with the recommendations of the International Society for Clinical Densitometry. As the reference population to calculate the T and Z scores, we used the one from the NHANES III study for femoral neck and total hip and the one from the Study of the Spanish Population for total spine. With the data of the questionnaire, we calculated, by FRAX, the absolute risk in the next ten years of having a major fracture (MFR) or a hip fracture (HFR). Both risks were calculated with or without the inclusion in the algorithm of BMD: MFR+, MFR−, HFR+ and HFR−. The results were recorded in an Access 2003 database and analyzed with the statistical package SPSS 15.0 for Windows.
ResultsWe analyzed the data from 853 women with a mean age of 61.9 (8.9) years and a mean body mass index of 27.0 (4.2)kg/m2. Mean BMD at lumbar spine was 0.873 (0.127)g/cm2; at femoral neck, 0.704 (0.105)g/cm2; and at total hip, 0.817 (0.107)g/cm2. Twenty percent of the patients had a normal BMD, 55% had osteopenia and 25%, osteoporosis. Yet excluding age and body mass index, the number of fracture risk factors seems low: 31% of the patients had no risk of fracture; 40%, had one; 22%, two; 6%, three; 1%, four; and one patient had five. Mean MFR+ was 5.4 (4.8)%; mean MFR−, 6.3 (5.5)%; mean HFR+, 1.5 (2.9)%; and HFR−, 2.1 (3.3)%.
When BMD was included in the algorithm for the calculation of the risk of fracture, the risk was statistically lower (p<0.001), especially in patients with better BMD.
ConclusionsThe risk of fracture calculated by FRAX in the patients sent to a densitometry unit for bone BMD testing seems low and, probably, a better selection of the patients would detect a higher risk of fracture population. When the fracture risk is calculated with the introduction of BMD in the algorithm, it is lower than without including BMD.
Analizar el riesgo de fractura calculado por FRAX y sus determinantes en los pacientes remitidos a una unidad de densitometría ósea para evaluación de la densidad mineral ósea (DMO).
MétodosLos pacientes remitidos desde Atención Primaria a la Unidad de Densitometría para evaluación de la DMO rellenaron un cuestionario autoadministrado acerca de los factores de riesgo clínicos incluidos en el FRAX; se les realizó una densitometría ósea. Con los datos del cuestionario, se analizó el riesgo absoluto de presentar una fractura mayor (MFR) y de cadera (HFR). Ambos riesgos se calcularon con o sin la inclusión de la DMO en el algoritmo: MFR+, MFR-, HFR+ y HFR-.
ResultadosSe analizaron los datos de 853 mujeres con una edad media de 61,9 (8,9) años y un índice de masa corporal medio de 27,0 (4,2) kg/m2. El 20% de las pacientes tenía una DMO normal, el 55% tenía osteopenia y el 25%, osteoporosis. Excluyendo la edad y el índice de masa corporal, el número de factores de riesgo de fractura fue bajo. El MFR+ medio fue de 5,4 (4,8)%; el MFR- de 6,3 (5,5)%; el HFR+, de 1,5 (2,9)%; y el HFR- de 2,1 (3,3)%. Cuando se incluyeron los valores densitométricos en el algoritmo de cálculo del riesgo de fractura, éste fue significativamente menor (p < 0,001), especialmente en pacientes con mejor DMO.
ConclusionesEn nuestro medio, el riesgo de fractura calculado por FRAX en las pacientes remitidas a la unidad de densitometría para evaluación de la DMO es bajo. El riesgo de fractura es inferior cuando se introduce la DMO en el algoritmo de cálculo.
Osteoporosis is highly prevalent and has several important medical, social and economical consequences related to its clinical manifestation, the fracture.
Many attempts to identify those people with a high risk of fracture to who apply primary or secondary prevention have been made. With the development of bone densitometry, scales to select people with low bone mass were proposed because of the close relation of bone mineral density (BMD) with the risk of fracture. Later, the epidemiological studies identified clinical risk factors that associate to an increase in the risk of fracture, independently of BMD.1 With these clinical risk factors, some indexes to identify the patients with a higher risk and, in consequence, aimed to make intervention have been proposed2–7 in a similar way as we calculate cardiovascular risk.8
Since March 2008, a new scale to calculate the absolute risk of fracture in the next 10 years, FRAX, has become available online.9 As relevant clinical risk factors, this tool includes age, sex, body mass index, previous low impact fracture, parental hip fracture, current smoking and alcoholic intake, the use of systemic steroids, rheumatoid arthritis and other causes of secondary osteoporosis; the T-score of femoral neck calculated by DXA may be optionally included if it is available. With these parameters, an algorithm calculates the absolute risk in the next 10 years of having a major fracture (MFR) or a hip fracture (HFR). The relative weight of every of the clinical risk factors for the calculation of the fracture risk was extracted from several epidemiological studies and the risk of having a major fracture, from the data of Malmö in Sweden; finally, the data were adapted to the fracture incidence and mortality in every country and the results were validated in independent cohorts.10
Previously, we have evaluated the activity of our Bone Densitometry Unit in different clinical situations and from different points of view.11–14 The relevance that FRAX has acquired in the field of osteoporosis has led us to analyze the results of the bone scannings we make in our unit in real clinical practice in relation to the risk of fracture calculated by FRAX and its determinants.
MethodsStudy settingThe study has been developed in the Densitometry Unit of a university tertiary hospital in an urban area in North-Eastern Spain.
The unit began to work in 1992. Since 2004, following the acquisition of a densitometer Hologic QDR 4500, we make more than 10,000 scannings every year. The patients are submitted to the unit by physicians from Primary Care and from the hospital and programmed in different agendas depending on their origin. Primary care physicians include the specialized physicians, mainly rheumatologists, orthopedics surgeons and gynecologists who depend contractually on the hospital and visit some days in a week to the primary care centers in the surrounding area.
We make all the scannings indicated by the physicians without any filter.
Study designFrom May to October 2008 the patients submitted from Primary Care to the Densitometry Unit for scanning were asked to fulfill an auto-administered questionnaire containing questions about the fracture risk factors included in FRAX. Primary Care physicians sent their patients for scanning independently of the risk of fracture calculated by FRAX.
As we included only the patients listed in the afternoon agendas, they were assisted in completing the questionnaire, when necessary, by the same technician. With the data in the questionnaire, we calculated MFR and HFR. Both risks were calculated with (+) or without (−) the inclusion in the algorithm of BMD. So, we obtained four risk calculations: MFR+, MFR−, HFR+ and HFR−.
All the patients had a densitometry of lumbar spine and proximal femur. The database of reference for the calculation of T- and Z-score was the one from the NHANES III study for femoral neck and total hip15 and the one from the Study of the Spanish Population for total spine.16 Patients were assigned to the normal, osteopenia or osteoporosis categories following the International Society for Clinical Densitometry recommendations.
We included 881 patients. Ninety-seven percent of them were women and we decided not to analyze the 28 men; there were 853 women left.
Statistical studyAll the data were gathered in a database Access 2003. The statistical study was made with the SPSS program for Windows version 15.0.
The descriptive analysis is presented as absolute number of cases (percentage) or as mean (standard deviation; interval of confidence of 95%).
The differences between qualitative variables were analyzed by means of the χ2-squared test. For the study of the differences between groups of patients, we applied analysis of the variance in case of parametric variables and Mann–Whitney or Kruskal–Wallis tests (according to the number of groups) in the case of nonparametric variables.
The limit of statistical significance was located in an α error of 0.05. The calculated statistical power for the differences in MFR+ and MFR− was 97.5%.
ResultsWe analyzed the data from 853 women with a mean age of 62 (9) years and a mean body mass index of 27.0 (4.2)kg/m2. In Table 1, we present the demographic and clinical parameters included in FRAX as fracture risk factors of these patients.
Demographic and clinical parameters included in FRAX as fracture risk factors of the patients included in the study [n (%) or mean±SD].
| Age | 62±9 years |
| Weight | 65.9±10.8kg |
| Height | 1.56±0.06m |
| Body mass index | 27.0±4.2kg/m2 |
| Previous fracture | 222 (26%) |
| Parent fractured hip | 121 (14%) |
| Current smoking | 94 (11%) |
| Glucocorticoids | 84 (10%) |
| Rheumatoid arthritis | 82 (10%) |
| Secondary osteoporosis | 306 (36%) |
| Alcohol 3 or more units per day | 2 (1%) |
| Bone mineral density | |
| Total lumbar spine | 0.874±0.127g/cm2 |
| T-score | −1.50±1.20 |
| Femoral neck | 0.704±0.105g/cm2 |
| T-score | −1.25±0.96 |
| Total hip | 0.817±0.107g/cm2 |
| T-score | −1.05±1.10 |
Twenty percent of the patients had a normal bone mineral density, 55% had osteopenia and 25%, osteoporosis.
Yet excluding age and body mass index, the number of fracture risk factors seems low among the patients included in the study. Twenty-six percent of the patients had no risk of fracture; 35%, one; 30%, two; 6%, three; and 3% had four or five risks of fracture. The high prevalence of secondary osteoporosis (36%) is explained almost entirely by the item “menopause before 45 years”, probably the reason for BMD scanning.
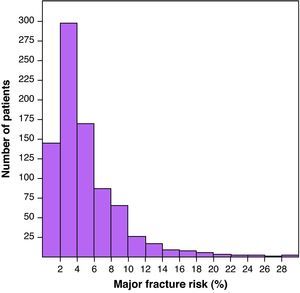
Mean MFR+ was 5.4 (4.8)%. The histogram of the distribution of MFR+ presented in Fig. 1 shows an accumulation of the patients in very low levels of risk of fracture. Mean MFR− was 6.3 (5.5)%; mean HFR+, 1.5 (2.9)%; and HFR−, 2.1 (3.3)%.
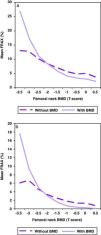
When BMD was included in the algorithm for the calculation of the risk of fracture, the risk was statistically lower (p<0.001) as shown in Fig. 2, especially in patients with better BMD. As a rule, the inclusion of BMD in the algorithm worsens risk fracture in patients with T-score below −2.
If we exclude from the analysis the patients who are already in treatment for osteoporosis (210 patients treated, 641 patients untreated), MFR+ becomes even lower: 5.0 (4.6)%. Patients without treatment are younger (61 (9) years versus 64 (8) years) and their frequency of osteoporosis, lower (21% versus 37%), in a statistically significant way.
DiscussionThe generalised use of DXA is limited because it is expensive and time consuming; it is not portable, and it is available only in specialised clinics. The best strategy to avoid waiting lists in Bone Densitometry Units has been the selection of patients at high risk of osteoporosis.
Now, the concept has changed. The target is not the osteoporotic patient but the patient at high risk of fracture. Formerly, for instance, a prior fragility fracture was a classic indication for BMD testing from the point of view of screening for osteoporosis. However, it is not a novelty that, for most clinicians, the diagnosis of a low trauma fracture is an indisputable reason to initiate specific treatment for osteoporosis without a measurement of BMD.
Since FRAX has become available, some uncertainty raises about the necessity of determining BMD in many patients: not only an opportunity but also a challenge has emerged. The real change lies in the acceptation that, not only hard clinical risk factors such as fragility fractures or glucocorticoid intake, but also the combination of several minor risk factors may achieve a level of risk of fracture enough to initiate a fracture prevention treatment without knowing BMD. At the other end of things, many physicians accept that fracture prevention treatments may be not indicated in patients with osteoporosis but low risk of fracture and, then, it would be unnecessary to know their BMD.
In a previous study, we have estimated the fracture risk by FRAX in patients in which the decision to treat or not had been taken along with previous recommendations in real clinical practice and knowing BMD: such as expected or desired, treated patients had more risk factors and their fracture risk was higher. Nevertheless, there was a significant, and probably excessive, overlap between the fracture risks of the two groups.17
Therefore, it seems relevant to define the strategy for the selection of the target population who should undergo BMD testing, avoiding high risk patients, who will be treated without knowing BMD, and low risk patients, who will not be treated independently of their BMD. In fact, we are looking for the patients with a moderate risk of fracture in which BMD may help to make a therapeutic decision. The problem is that, in most countries, it has not been defined what is low, moderate or high risk.
The first step, the one we have intended to address in this study, is to analyze the activity we make in our unit in real clinical practice in relation to the risk of fracture calculated by FRAX. Two main conclusions can be drawn from our results: one, the risk of fracture of the patients sent to our densitometry unit for bone BMD testing is low (71% of the patient had none or one risks or fracture); and two, the introduction of BMD in the algorithm for the calculation of the risk results in a decrease of the risk, except in the patients with BMD below −2 standard deviations of the T-score. These patients with moderate risk and lower BMD are the ones who most benefit from BMD testing but, in our series, there are few of them. It is clear that we need to search a strategy to improve the quality of the referrals to our unit or, in other words, to increase the risk fracture of the patients referred.
The FRIDEX study group, not far geographically from us, has calculated that the use of NOGG thresholds10 applied to FRAX would reduce about to 50% the current number of referrals for BMD testing, thus allowing to focus the activity of bone densitometry units in the patients with moderate fracture risk.18 However, the application of these thresholds, calculated for the United Kingdom, to the Spanish population is not advisable as our risk of fracture is somewhat lower: the United States has been classified as a very high risk country and Spain, a medium risk country. As an example, women aged 70 with a previous fragility fracture have a MFR of 21%, close to the 20% NOGG threshold, if calculated by FRAX for US Caucasian population. The same women have a MFR of 10% when the risk is calculated by FRAX for the Spanish population. The threshold of high risk for us might be perfectly located, then, at 10%; accordingly, an estimate of the threshold for moderate risk could be 5%.
Agreement between risk of fracture with and without the inclusion of BMD in the FRAX algorithm has been analyzed in 180 white women from Tennessee, USA19; it achieved 89.4%. Disagreement occurred in 2 distinct subgroups of patients (10.6% of cases): one comprised older patients with normal T-scores for whom FRAX-scores exceeded the NOF treatment threshold; the other, younger patients with high BMI and low T-scores for whom FRAX-scores did not exceed the threshold. In accordance with the above approach, the latter should not be treated independently of their BMD and, so, BMD testing was not necessary. The first subgroup gives more to think as treatment could be initiated directly without knowing BMD but, in fact, when BMD testing is made, the treatment can be avoided. In our series, 16 out of 29 patients with RFM above 20% (2% of the whole series) and 72 out of 153 above 10% (8%), fall below every threshold when BMD is known and RFM recalculated.
As a limitation, a selection bias exists because the patients were recruited from a Bone Densitometry Unit and not from the general population. Although this is a low risk fracture population, we estimate that the frequency of risk factors of fracture and the prevalence of osteoporosis are higher in the general population of the same age.
Two strategies would be good to clarify the raised issues in future studies: the selection of patients with moderate risk of fracture assessed by FRAX or the inclusion of a large number of subjects from general population. The former seems more operational to analyze the actual value of knowing BMD in these patients since the practice of a bone densitometry is probably not necessary in low and high risk fracture patients. We need more data that allow us to select properly the patients who benefit most from the practice of a BMD testing.
Responsabilidades éticasProtección de personas y animales. Los autores declaran que para esta investigación no se han realizado experimentos en seres humanos ni en animales.
Confidencialidad de los datos. Los autores declaran que han seguido los protocolos de su centro de trabajo sobre la publicación de datos de pacientes y que todos los pacientes incluidos en el estudio han recibido información suficiente y han dado su consentimiento informado por escrito para participar en dicho estudio.
Derecho a la privacidad y consentimiento informado. Los autores han obtenido el consentimiento informado de los pacientes y/o sujetos referidos en el artículo. Este documento obra en poder del autor de correspondencia.
Conflict of interestThe authors declare no conflict of interest.
Please, cite this article as: Gómez-Vaquero C, et al. The activity of a Spanish bone densitometry unit revisited under the point of view of FRAX. Reumatol Clin. 2012;8:179-83.


