A subset of gout patients developed persistent joint pain after flares. Analysis of this clinical phenomenon may shed further light on the factors related to worsening gout and even provide clues to its pathogenesis.
MethodsWe analyzed the clinical, laboratory, and ultrasound data of gout patients to explore the associations of these data with persistent joint pain after gout flares.
ResultsA total of 1029 gout patients were included: 182 (17.7%) patients with persistent joint pain and 847 (82.3%) patients with nonpersistent joint pain. Patients with persistent joint pain had more total involved joints, more gout flares in the past year, and more joints with simultaneous gout flares (P<0.01). Among the ultrasound-detected lesions, patients with persistent joint pain had a higher incidence of tophus (36.4% vs. 21.1%) and bone erosion (18.6% vs. 8.6%) (P<0.05). Higher UA and lower TBil were found in patients with persistent joint pain (P<0.001). Hypertension (54.9% vs. 38.7%) and metabolic syndrome (58.8% vs. 46.4%) were both more frequent in patients with persistent joint pain (P<0.05). TBil was negatively correlated with the incidence of persistent joint pain (P<0.001, r=−0.190), UA values (P<0.001, r=−0.125), and metabolic syndrome scores (P<0.001, r=−0.192). A correlation curve was fitted using LOESS (locally weighted region).
ConclusionPersistent joint pain after gout flares is a marker of increased disease burden in gout. The significance of the level of total bilirubin for the exacerbation of gout deserves further study.
Un subgrupo de pacientes con gota desarrolló dolor articular persistente tras los brotes. El análisis de este fenómeno clínico puede arrojar más luz sobre los factores relacionados con el empeoramiento de la gota e incluso proporcionar pistas sobre su patogenia.
MétodosAnalizamos los datos clínicos, de laboratorio y de ultrasonido de los pacientes para explorar la asociación de estos datos con el dolor articular persistente después de un ataque de gota.
ResultadosSe incluyeron 1029 pacientes en el estudio: 182 (17,7%) con dolor articular persistente y 847 (82,3%) con dolor articular insostenible. Los pacientes con dolor articular persistente tenían un mayor número total de articulaciones afectadas, más ataques gotosos en el último año y más articulaciones con ataques gotosos simultáneos (p<0,01), y los pacientes con dolor articular persistente tenían una mayor incidencia de cálculos gotosos (36,4% frente a 21,1%) y erosión ósea (18,6% frente a 8,6%) (p<0,05). Los pacientes con dolor articular persistente tenían un ácido úrico más alto y una bilirrubina más baja (p<0,001). La hipertensión arterial (54,9% frente al 38,7%) y el síndrome metabólico (58,8% frente al 46,4%) son más frecuentes en pacientes con dolor articular persistente (p<0,05). La bilirrubina se asocia negativamente con la incidencia de dolor articular persistente, ácido úrico y síndrome metabólico. Una curva de correlación fue ajustada con Loess (región de peso local).
ConclusiónEl dolor articular persistente después del ataque de gota es una marca de aumento de la carga de la enfermedad en la gota. La importancia de los niveles de bilirrubina total en el empeoramiento de la gota merece un estudio más detallado.
Gout, a common inflammatory arthritis, is induced by the local formation and deposition of monosodium urate crystals in joints due to excess serum uric acid in blood or tissue fluid.1,2 The global burden of gout disease is rapidly growing, and although the reported prevalence of gout varies from region to region and ranges from <1% to 6.8%, poor medication adherence and failure to control diet are common phenomena in patients with gout.3
The typical arthritis of gout is a monoarthritis attack of the lower extremities with severe pain, localized swelling, and reddened skin, which usually resolves completely in 1–2 weeks, even without treatment.4,5 However, with the dual influence of disease duration continuation and irregular treatment, the arthritic manifestations of gout become atypical or even refractory, such as when the joint is no longer in complete remission within 2 weeks, multiple joints have flares simultaneously, and the frequency of flares markedly increases.6,7
The persistence of joint pain after gout flares is likely to be a key turning point in the progression of gout from punctuated attacks to chronic arthritis.8,9 In-depth dissection of this clinical state can help clinicians judge a patient's condition and even provide clues to explore metabolic pathways or novel therapeutic targets associated with gout exacerbation. Currently, little is known about the clinical significance and associated factors of persistent joint pain after gout flares. This study retrospectively collected detailed data on these patients and explored the associated clinical, laboratory, and imaging factors of this clinical condition from several aspects.
Materials and methodsThis was a cross-sectional study which included gout patients who visited Beijing Jishuitan Hospital from January 2016 to December 2022, and those who met the inclusion and exclusion criteria were included in the analysis in the final study. This study was approved by the ethics review of the Beijing Jishuitan Hospital (approval of Ethics Committee: Jilun[K2023]-[125]-00).
PatientsData for patients with a diagnosis of gout were obtained in the electronic medical record system of Beijing Jishuitan Hospital. Then, the study subjects were included after screening with the inclusion and exclusion criteria. The inclusion criteria were as follows: (1) meeting the 2015 ACR/EULAR classification criteria for gout (≥8 points); (2) VAS score greater than or equal to 4 at gout flare; (3) VAS scores recorded more than 2 times; and (4) VAS score was recorded at least every 2 weeks after gout flare and the number of times documented was ≥3 times. The exclusion criteria were as follows: (1) other inflammatory arthritis, such as rheumatoid arthritis, ankylosing spondylitis, psoriatic arthritis, reactive arthritis and infectious arthritis, among others; (2) severe liver and kidney disease; and (3) chronic infections, such as tuberculosis, viral hepatitis (hepatitis B, C, etc.), and brucellosis. The VAS (Visual Analog Score) ranges from 0 to 10 points. Patients with VAS≥4 points after 4 weeks of gout flares were included in the persistent joint-pain group, and patients with VAS=0 points were included in the nonpersistent joint-pain group.
Data collection and definitionDemographic information, present medical history and physical examination data, laboratory tests, and musculoskeletal ultrasound results were obtained from the electronic medical record system. Detailed records of the involved joints with gout, the number of gout flares in the last 1 year, the joint sites with gout flares at the time of inclusion in the study, and VAS scores were obtained. History of alcohol consumption, smoking, family history, hypertension, diabetes, CVD and medication after gout flare were recorded. Disease duration was defined as the time from the first gout flare to the time of inclusion in the study. A senior sonographer reviewed the musculoskeletal ultrasound findings and resolved four gout-related lesions based on international expert consensus10: tophus, double contour, aggregates, and erosion. Metabolic syndrome was defined as having at least 3 of the following11: (1) abdominal obesity: waist circumference≥90cm for men and ≥85cm for women; (2) hyperglycemia: fasting plasma glucose≥6.1mmol/L or a 2-h glucose load≥7.8mmol/L and/or had been treated for established diabetes; (3) hypertension: blood pressure≥130/85mmHg and/or had confirmed hypertension and been treated; (4) fasting TG≥1.70mmol/l; and (5) fasting HDL-C<1.04mmol/l. The metabolic score equals the number of metabolic syndrome components.
Statistical analysisR (version 4.2.2) was used to analyze all data. Measurements meeting a normal distribution are presented as the mean with standard deviation (mean±SD), and measurements not meeting a normal distribution are presented as the median and interquartile range [M (Q1, Q3)]. The counting data were expressed as numbers and percentages. Chi-square tests were used to compare differences in rates between two or more groups. Contrasts of metered data between two groups were evaluated according to whether they conformed to a normal distribution using Student's t test or a nonparametric test (Mann–Whitney). Comparisons of multigroup metrology data that conformed to a normal distribution and were homogeneous in variance were performed by one-way ANOVA. Multigroup metrology data that did not follow a normal distribution were compared by a nonparametric test (Kruskal–Wallis H). Logistic regression was used to correct for confounders between the independent variable and the dependent variable. P values were corrected using the Bonferroni method after pairwise comparisons. The Spearman correlation test was used to analyze the correlation between two variables, and LOESS (locally weighted regression) was used to fit the curve between two variables. Two-sided P values<0.05 were considered to indicate statistical significance.
ResultsA total of 1029 gout patients were included in the study; 1007 (97.9%) were men, and the mean age was 41.1±14.2 years. There were 182 (17.7%) patients who developed persistent joint pain after gout flares, and the duration of persistent joint pain was 8 weeks (4 weeks, 12 weeks). The top three joints with persistent joint pain involvement were the knees (93, 51.1%), ankles (73, 40.1%), and metatarsophalangeal joints (14, 7.7%).
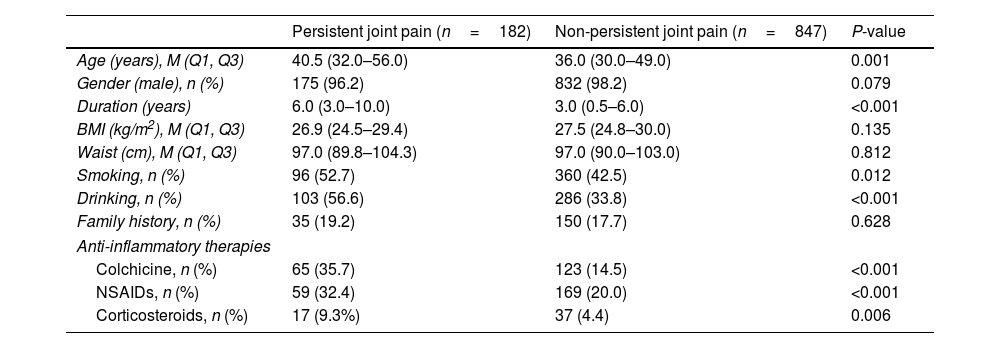
Demographic and basic clinical informationCompared with patients with nonpersistent joint pain, patients with persistent joint pain after gout flares were older, had longer disease duration, and had more patients with a history of smoking and drinking. There were no significant differences in sex, BMI, waist circumference, or family history between the two groups. Patients with persistent joint pain used more anti-inflammatory drugs, including colchicine, NSAIDs, and glucocorticoids, as shown in Table 1.
Demographic and basic clinical information of patients with persistent and non-persistent joint pain after gout flare.
| Persistent joint pain (n=182) | Non-persistent joint pain (n=847) | P-value | |
|---|---|---|---|
| Age (years), M (Q1, Q3) | 40.5 (32.0–56.0) | 36.0 (30.0–49.0) | 0.001 |
| Gender (male), n (%) | 175 (96.2) | 832 (98.2) | 0.079 |
| Duration (years) | 6.0 (3.0–10.0) | 3.0 (0.5–6.0) | <0.001 |
| BMI (kg/m2), M (Q1, Q3) | 26.9 (24.5–29.4) | 27.5 (24.8–30.0) | 0.135 |
| Waist (cm), M (Q1, Q3) | 97.0 (89.8–104.3) | 97.0 (90.0–103.0) | 0.812 |
| Smoking, n (%) | 96 (52.7) | 360 (42.5) | 0.012 |
| Drinking, n (%) | 103 (56.6) | 286 (33.8) | <0.001 |
| Family history, n (%) | 35 (19.2) | 150 (17.7) | 0.628 |
| Anti-inflammatory therapies | |||
| Colchicine, n (%) | 65 (35.7) | 123 (14.5) | <0.001 |
| NSAIDs, n (%) | 59 (32.4) | 169 (20.0) | <0.001 |
| Corticosteroids, n (%) | 17 (9.3%) | 37 (4.4) | 0.006 |
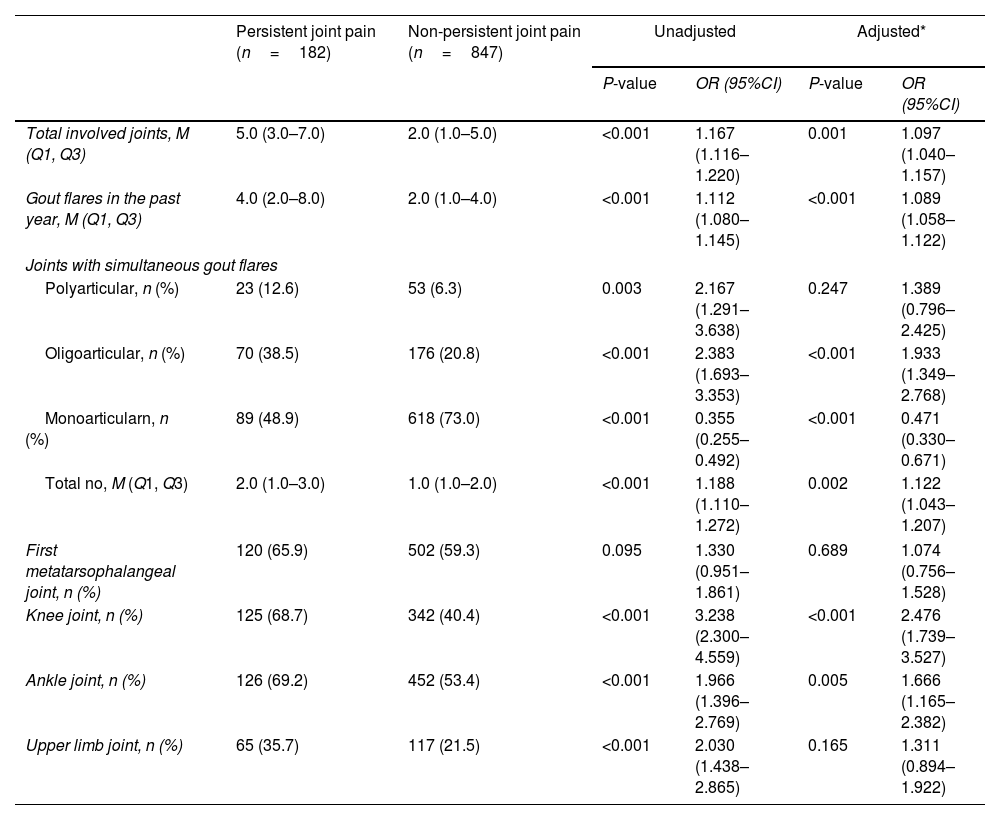
Disease burden related to joints was significantly more severe in patients with persistent joint pain after gout flares than in those with nonpersistent joint pain. Patients with persistent joint pain had more total involved joints [5.0 (3.0–7.0) vs. 2.0 (1.0–5.0)], more gout flares in the past year [4.0 (2.0–8.0) vs. 2.0 (1.0–4.0)], and more joints with simultaneous gout flares [2.0 (1.0–3.0) vs. 1.0 (1.0–2.0)], all P<0.01 after adjustment for age, duration, and drinking. As shown in Table 2.
Comparison of joint involvement in patients with persistent and non-persistent joint pain after gout flare.
| Persistent joint pain (n=182) | Non-persistent joint pain (n=847) | Unadjusted | Adjusted* | |||
|---|---|---|---|---|---|---|
| P-value | OR (95%CI) | P-value | OR (95%CI) | |||
| Total involved joints, M (Q1, Q3) | 5.0 (3.0–7.0) | 2.0 (1.0–5.0) | <0.001 | 1.167 (1.116–1.220) | 0.001 | 1.097 (1.040–1.157) |
| Gout flares in the past year, M (Q1, Q3) | 4.0 (2.0–8.0) | 2.0 (1.0–4.0) | <0.001 | 1.112 (1.080–1.145) | <0.001 | 1.089 (1.058–1.122) |
| Joints with simultaneous gout flares | ||||||
| Polyarticular, n (%) | 23 (12.6) | 53 (6.3) | 0.003 | 2.167 (1.291–3.638) | 0.247 | 1.389 (0.796–2.425) |
| Oligoarticular, n (%) | 70 (38.5) | 176 (20.8) | <0.001 | 2.383 (1.693–3.353) | <0.001 | 1.933 (1.349–2.768) |
| Monoarticularn, n (%) | 89 (48.9) | 618 (73.0) | <0.001 | 0.355 (0.255–0.492) | <0.001 | 0.471 (0.330–0.671) |
| Total no, M (Q1, Q3) | 2.0 (1.0–3.0) | 1.0 (1.0–2.0) | <0.001 | 1.188 (1.110–1.272) | 0.002 | 1.122 (1.043–1.207) |
| First metatarsophalangeal joint, n (%) | 120 (65.9) | 502 (59.3) | 0.095 | 1.330 (0.951–1.861) | 0.689 | 1.074 (0.756–1.528) |
| Knee joint, n (%) | 125 (68.7) | 342 (40.4) | <0.001 | 3.238 (2.300–4.559) | <0.001 | 2.476 (1.739–3.527) |
| Ankle joint, n (%) | 126 (69.2) | 452 (53.4) | <0.001 | 1.966 (1.396–2.769) | 0.005 | 1.666 (1.165–2.382) |
| Upper limb joint, n (%) | 65 (35.7) | 117 (21.5) | <0.001 | 2.030 (1.438–2.865) | 0.165 | 1.311 (0.894–1.922) |
Adjusted*=adjusted for age, duration and drinking.
Musculoskeletal ultrasound was performed in 585 patients, including 129 patients with persistent joint pain and 456 patients with nonpersistent joint pain. Among the lesions explored by musculoskeletal ultrasound associated with gout, patients with persistent joint pain had a higher incidence of tophus (36.4% vs. 21.1%) and bone erosion (18.6% vs. 8.6%), with all P values<0.05 after adjustment for age, duration, and drinking. Double contour was observed in 28.7% of patients with persistent joint pain and 19.3% of patients with nonpersistent joint pain, P<0.05 before adjustment for confounders and P=0.221 after adjustment, as shown in Fig. 1.
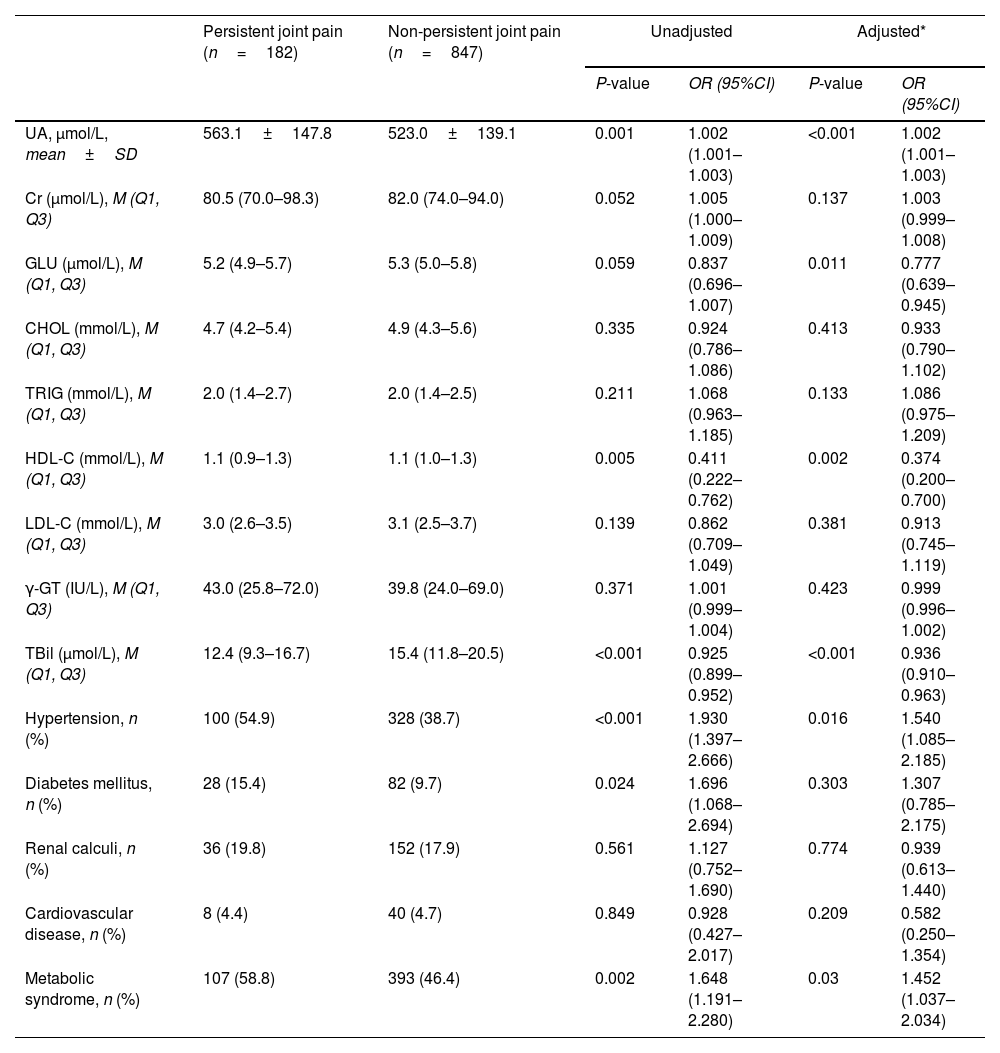
Laboratory measures and comorbiditiesIn terms of laboratory measures, higher UA [563.1±147.8 vs. 523.0±139.1, μmol/L] and lower TBil [12.4 (9.3–16.7) vs. 15.4 (11.8–20.5), μmol/L] were found in patients with persistent joint pain, with all P values<0.001 after adjustment for age, duration, and drinking. In terms of comorbidities, hypertension [54.9% vs. 38.7%] and metabolic syndrome (58.8% vs. 46.4%) were both more frequent in patients with persistent joint pain, with all P values<0.05 after adjustment for age, disease duration, and drinking, as shown in Table 3.
Laboratory measures and comorbidities in patients with persistent and non-persistent joint pain after gout attack.
| Persistent joint pain (n=182) | Non-persistent joint pain (n=847) | Unadjusted | Adjusted* | |||
|---|---|---|---|---|---|---|
| P-value | OR (95%CI) | P-value | OR (95%CI) | |||
| UA, μmol/L, mean±SD | 563.1±147.8 | 523.0±139.1 | 0.001 | 1.002 (1.001–1.003) | <0.001 | 1.002 (1.001–1.003) |
| Cr (μmol/L), M (Q1, Q3) | 80.5 (70.0–98.3) | 82.0 (74.0–94.0) | 0.052 | 1.005 (1.000–1.009) | 0.137 | 1.003 (0.999–1.008) |
| GLU (μmol/L), M (Q1, Q3) | 5.2 (4.9–5.7) | 5.3 (5.0–5.8) | 0.059 | 0.837 (0.696–1.007) | 0.011 | 0.777 (0.639–0.945) |
| CHOL (mmol/L), M (Q1, Q3) | 4.7 (4.2–5.4) | 4.9 (4.3–5.6) | 0.335 | 0.924 (0.786–1.086) | 0.413 | 0.933 (0.790–1.102) |
| TRIG (mmol/L), M (Q1, Q3) | 2.0 (1.4–2.7) | 2.0 (1.4–2.5) | 0.211 | 1.068 (0.963–1.185) | 0.133 | 1.086 (0.975–1.209) |
| HDL-C (mmol/L), M (Q1, Q3) | 1.1 (0.9–1.3) | 1.1 (1.0–1.3) | 0.005 | 0.411 (0.222–0.762) | 0.002 | 0.374 (0.200–0.700) |
| LDL-C (mmol/L), M (Q1, Q3) | 3.0 (2.6–3.5) | 3.1 (2.5–3.7) | 0.139 | 0.862 (0.709–1.049) | 0.381 | 0.913 (0.745–1.119) |
| γ-GT (IU/L), M (Q1, Q3) | 43.0 (25.8–72.0) | 39.8 (24.0–69.0) | 0.371 | 1.001 (0.999–1.004) | 0.423 | 0.999 (0.996–1.002) |
| TBil (μmol/L), M (Q1, Q3) | 12.4 (9.3–16.7) | 15.4 (11.8–20.5) | <0.001 | 0.925 (0.899–0.952) | <0.001 | 0.936 (0.910–0.963) |
| Hypertension, n (%) | 100 (54.9) | 328 (38.7) | <0.001 | 1.930 (1.397–2.666) | 0.016 | 1.540 (1.085–2.185) |
| Diabetes mellitus, n (%) | 28 (15.4) | 82 (9.7) | 0.024 | 1.696 (1.068–2.694) | 0.303 | 1.307 (0.785–2.175) |
| Renal calculi, n (%) | 36 (19.8) | 152 (17.9) | 0.561 | 1.127 (0.752–1.690) | 0.774 | 0.939 (0.613–1.440) |
| Cardiovascular disease, n (%) | 8 (4.4) | 40 (4.7) | 0.849 | 0.928 (0.427–2.017) | 0.209 | 0.582 (0.250–1.354) |
| Metabolic syndrome, n (%) | 107 (58.8) | 393 (46.4) | 0.002 | 1.648 (1.191–2.280) | 0.03 | 1.452 (1.037–2.034) |
Adjusted*=adjusted for age, duration and drinking.
With increasing quartiles of TBil, the incidence of persistent joint pain decreased (P for trend<0.001), uric acid decreased progressively (P for trend<0.001) and the incidence of metabolic syndrome decreased progressively (P for trend<0.001), as shown in Fig. 2.
LOESS (locally weighted regression) was used to fit the curve of TBil to the incidence of persistent joint pain, uric acid values and metabolic syndrome scores. TBil was negatively correlated with the incidence of persistent joint pain (P<0.001, r=−0.190), with UA values (P<0.001, r=−0.125), and with metabolic syndrome scores (P<0.001, r=−0.192) (Fig. 3).
DiscussionChronic pain significantly affects people's quality of life and daily activities and has a multifaceted impact on patients’ emotional and psychological well-being.12 Acute episodes of severe pain are typical at the onset of gout, and such pain usually resolves within 2 weeks with a period of complete remission, which can range from a few months to years.13 Chronic pain begins to appear in gout patients as the disease worsens. Chronic pain is also one of the clinical manifestations in patients with gout, as 182 (17.7%) patients in this study developed persistent pain for >4 weeks after gout flares. The reason for this persistent joint pain may be that as the condition continues to progress, metabolic and immune interaction homeostasis is further imbalanced, and monosodium urate crystals are no longer easily and completely dissolved, which continually stimulates inflammatory production.14–16 The musculoskeletal ultrasound findings in this study could support this idea. Higher incidences of tophi and double contour signs were detected by ultrasonography in patients with persistent joint pain after gout flares.
Joint involvement by gout can manifest as synovitis, tendon inflammation, excessive deposition of monosodium urate (tophi or double contour sign), bone erosion, and ultimately destruction of joint architecture, thereby limiting joint mobility.17–20 Arthritis represents a major disease burden in gout. The results in this study demonstrate that patients with persistent joint pain after gout flares have a significantly greater joint disease burden, including more affected joints, more flares in the last year, and a greater number of simultaneous flares. These results suggest that persistent joint pain occurrence implies an aggravation of joint disease burden and that this symptom may be a turning point in the progression of gout to the chronic phase.
Tophi and bone erosion are closely associated with persistent monosodium urate deposition and are culprits for the destruction of joint architecture.21–23 Musculoskeletal ultrasound, which enables earlier detection of tophi and bone erosion, is a sensitive method of quantifying the progression of gout.24,25 The results of this article showed a higher incidence of tophi and bone erosion detected by ultrasound in patients with persistent joint pain, suggesting that the presence of this simple symptom is a marker of further worsening of gouty joint involvement. Patients with persistent joint pain after gout flares require strict adherence to the treat-to-target (T2T) of serum urate (SUA) to reduce the risk of joint destruction.
The spectrum of comorbidities of gout is very broad, including hypertension, diabetes, lipid metabolism abnormalities, metabolic syndrome, cardiovascular and cerebrovascular diseases, venous thrombosis, and even neurodegenerative diseases.26 The development of comorbidities is closely related to both hyperuricemia and monosodium urate-induced inflammation.27,28 The results of this study show that patients with persistent joint pain after gout flares had higher rates of both hypertension (54.9% vs. 38.7%) and metabolic syndrome (58.5% vs. 46.4%). Hyperuricemia is a major metabolic abnormality in gout, and the results of the present article also showed that patients with persistent joint pain had higher uric acid levels (563.1±147.8 vs. 523.0±139.1). Hypertension, metabolic syndrome, and hyperuricemia are risk factors for cardiovascular disease.26,29 Recent studies have also reported that gout flares are associated with a significant increase in cardiovascular events after flares.30 Patients with persistent joint pain after gout flares deserve our attention because of the very high number of gout flares per year and because they have a more severe metabolic syndrome, all of which are factors that predispose them to cardiovascular events.
Bilirubin is derived from the breakdown of heme, which is decomposed to form biliverdin under the action of heme oxygenase and subsequently reduced to bilirubin under the action of biliverdin reductase.31 Bilirubin was considered in the past as a marker of liver disease and jaundice, especially when excessively high levels of bilirubin would affect cellular metabolic activity and even lead to neurological damage.32,33 Currently, there is increasing evidence that mild or physiological elevations in bilirubin are protective against a variety of diseases, and bilirubin is an antioxidant that can directly scavenge reactive oxygen species and suppress oxidative stress.34,35 Among the numerous oxidants, bilirubin has the strongest activity of scavenging superoxide and peroxide radicals.36
Studies have shown that higher bilirubin levels are inversely associated with risk factors for cardiovascular disease, including obesity, dyslipidemia, and hypertension, and have associations with inflammatory diseases.37 Bilirubin plays antioxidant, anti-inflammatory and antidipogenic roles in these diseases, and bilirubin is a potentially valuable therapeutic target.38 The results of the present study, which showed a negative correlation between bilirubin levels and metabolic syndrome scores in patients with gout, are in line with the above reports. A large population cross-sectional study found an inverse association between bilirubin and new-onset hyperuricemia [OR (95% CI)=0.63 (0.50–0.81)].39 The present study provided further evidence of an inverse correlation between bilirubin levels and uric acid levels in patients with gout. Encouragingly, the results of the present study also showed an inverse correlation between bilirubin levels and the incidence of persistent joint pain after gout flares. Taken together, these results suggest that bilirubin may be a protective agent against the exacerbation of gout, and we expect more future studies to confirm our inference and successfully use it in clinical practice.
The limitations of this article include the following. First, this was a retrospective study, and some variables failed to be fully precisely controlled, such as the specific details of the urate-lowering therapy of the patients. Second, the primary outcome measures of this study included VAS scores, which were affected by some subjective factors. However, the pain triggered by a typical gout flare can typically be completely relieved within 2 weeks, which also reduces the bias caused by subjectivity in pain assessment. Third, due to the limitations of this cross-sectional study, it cannot show the follow-up development of patients with persistent joint pain after a gout flare.
In conclusion, persistent joint pain after a gout flare predicts worsening of the disease burden of gout in both dimensions of arthritis and comorbidity, and bilirubin has the potential to be a protective agent for gout exacerbation.
Authors’ contributionsWei Liu, Peng Dong, Chunyan Li, Husheng Wu, Hui Song conceived the project and designed the clinical study flow. Wen Guo reviewed the ultrasound reports and Kaiping Zhao developed the statistical methods for this paper. Wei Liu, Peng Dong, Siliang Man, Liang Zhang collected the clinical data. Wei Liu wrote the text of the article.
Data availability statementData that support the findings of this study are available from the corresponding author, Hui Song upon reasonable request.
Financial supportThe capital health research and development of special (2018-4-2075).
Conflicts of interestThe authors declare no competing interests.

