


To explore knowledge on musculoskeletal-diseases (MSDs) by the Spanish population.
MethodsThis was a cross-sectional study of the general population (>18 years) using a telephone survey of 1009 subjects stratified by habitat size, age, sex, and geographic area. A structured questionnaire was used to collect information on the subjects, their general knowledge of MSDs (GK), their specific knowledge of particular MSDs (SK), and their knowledge of their social impact (KSI). Synthetic indicators of the level of knowledge were used to analyze, using univariate and multivariate models, variables associated to the level of knowledge.
ResultsThe KSI level ranges from medium–high (mean: 0.62±0.16 out of 1), suggesting that most subjects recognize MSDs as disabling conditions which affect the ability to work and have a high personal and social cost. The GK level is intermediate (mean: 0.50±0.17); 60% of subjects know something about MSDs, but 54% state that their information is poor/very poor. The SK level is low (mean: 0.18±0.10), and there are some MSDs that are little known (lupus, spondylitis). Being male or retired or having a MSD is associated to a greater knowledge of MSDs.
ConclusionThe Spanish population has a medium level of knowledge of the frequency and extent to which MSDs affect performance of activities by those who suffer them. They identify them adequately and have a GK of their symptoms, but have little information about them. The level of knowledge varies depending on social and demographic factors and on whether or not the subject has direct or indirect experience of what a MSD means.
Explorar el conocimiento sobre enfermedades músculo-esqueléticas (EME) en la población española.
MétodosEstudio transversal, dirigido a la población general española mediante encuesta telefónica a 1.009 sujetos mayores de18 años estratificados por tamaño del hábitat, edad, género y zona geográfica. Con un cuestionario estructurado, se recogió información de los sujetos, su conocimiento general de las EME (CG), su conocimiento específico de EME concretas (CE) y su conocimiento del impacto social (CIS). Se elaboraron indicadores sintéticos (escala 0–1) de nivel de conocimiento para analizar, mediante análisis univariante y multivariante, las variables asociadas al nivel de conocimiento.
ResultadosEl nivel de CIS es medio-alto (media: 0,62±0,16) y recoge el reconocimiento mayoritario de las EME como incapacitantes, que afectan a la capacidad laboral y provocan un alto coste personal y social. El nivel de CG es intermedio (media: 0,50±0,17), un 60% conoce algo sobre las EME, aunque el 54% califica su información como mala/muy mala. El nivel de CE es bajo (media: 0,18±0,10), existiendo EME muy poco conocidas (lupus y espondilitis). Ser hombre, jubilado o presentar una EME, se asocia con más conocimiento sobre las EME.
ConclusiónLa población española tiene un nivel medio de conocimiento de la frecuencia y medida en que las EME afectan el desempeño de las actividades de quienes las presentan. Las identifican suficientemente, conociendo a grandes rasgos su sintomatología, aunque saben poco de ellas. El nivel de conocimiento varía según los factores sociodemográficos y la experiencia directa e indirecta de presentación de EME.
Musculoskeletal diseases (MD) are usually chronic, degenerative, with great social, economic and quality of life impact on patients and their family environment. They also lead to a considerable expense by health systems. However, despite their impact and significance, the extent of information on these diseases and their consequences possessed by citizens is unknown. There are few publications on the knowledge of the general population on these conditions. The results of some of these studies reflect the limited knowledge about them, especially rheumatoid arthritis (RA),1–7 something also observed in primary caregivers of women who have this disease.2
While some authors agree that both the general population3 and4 patients feel a moderate desire to know more about MD, many societal beliefs that relate to food, cold or wet weather, or osteoarthritis identified as rheumatoid arthritis, or who consider RA to be a curable disease persist.3,5,6 The lack of knowledge of the population about MD, particularly their symptoms, can cause delayed diagnosis and lead to delays in treatment, with no chance of avoiding structural damage to the joints, leading to a decreased quality of life and increased health spending.
In our environment, we found no publications on the knowledge of MD in the Spanish population. Therefore, we decided to develop this study in order to explore what Spanish people know about MD and identify subject characteristics associated with this knowledge.
Materials and MethodsDesignCross-sectional, descriptive-analytical; data obtained by a telephone survey addressed to the Spanish population. Field of study: national, except Ceuta and Melilla. Study subjects: people over 18 years working outside of the health field.
The sample was preset for a 3% accuracy in some critical variable of knowledge, assuming maximum uncertainty (p=q=0.5), and α of 0.05 was 1000 interviews. Sampling was proportional to the population and stratified according to five variables: population size (over 5 sections: <10000, 10000–50000, 50001–100000, 100001–500000, and >500000 inhabitants), age (<30 years, 30–44, 45–64, and >64 years), gender and geographical area (Andalusia, Catalonia, Madrid, Valencia, Basque Country, rest of North and rest of the South).
A structured questionnaire was developed from items from other similar projects of the research team (www.taiss.com/pubdisecues.htm), publications and websites7–14 patients and professionals related to the object of study. With the review of this information, the final questionnaire was developed, consisting of 27 questions grouped into 41 items. The demographic variables included were: (1) age, sex, educational level, employment status, type of work, (2) variables on knowledge of the social impact of MD: prevalence and impact on employment in job loss and disability caused by MD compared with other diseases, and their population-level consequences in terms of care burden, social cost, and impact on function, (3) variables on general knowledge of MD: knowledge on MD, recognition of them or their symptoms from a list of diseases and symptoms, the ability to specify up to 3 MD, knowledge on the more prevalent MD, and an evaluation to determine how much daily life, work and social activities, and purchasing power was affected in those with the disease, (4) variables on specific knowledge of 9 MD (back pain, arthritis, osteoarthritis, osteoporosis, rheumatoid arthritis, fibromyalgia, lupus, spondylitis and gout), evaluation on the knowledge of the epidemiological characteristics of the MD regarding age and sex, and knowledge of typical symptoms, (5) variables on MD by the respondent or a family member, and (6) an assessment of the quality of the information held on the matter, globally or regarding its symptoms, treatment and prevention, specifying the source of origin. The questionnaire can be downloaded from http://taiss.net/conocimiento-eme/Cuest-Pob-Gen-EMEs-V-Final.pdf.
Telephone interviews with the subjects, selected from the INFOBEL database,15 were conducted between October and November 2008 by trained personnel.
To meet the objective of the study, in addition to a descriptive study, we decided to group the information into synthetic indicators to report on the level of knowledge of MD and allow for comparisons of said level between subgroups. In developing these indicators, the researchers were advised by two rheumatologists selected by the Spanish Society of Rheumatology. Three indicators were constructed from the items in the corresponding sections of the questionnaire: knowledge on the social impact (KSI), general knowledge (GK) and specific knowledge (SK) of MD. Indicators were expressed as an integer relationship between the score attributable to the sum of the responses of each individual with respect to the total score for each obtainable indicator. The criteria for the development of composite indicators are shown in Table 1.
Criteria and Methodology for the Creation of Composite Indicators of Knowledge of MD.
| Synthetic indicators of knowledge of MD | ||
| Knowledge of social impact | General knowledge | Specific knowledge |
| Knowing how to classify two MD which are among the most prevalent in terms of:Disease prevalence (0–2 points depending on no. identified MD).Number of sick leave episodes (0–2 points according to identified MD no.)Number of work disability episodes caused (0–2 points depending on no. identified MDIdentify aspects of social impact (one point for each aspect):work capacity (4 items)Social Cost (2 items)Assistance care (one item)Global prevalence (one item)Score is added and becomes rate by dividing it by the maximum obtainable score (14) | Recognize 9 MD from a list of 13 diseases (0–2 points)Recognize 8 symptoms of a list of 11 (0 to 2 points)In both cases, obtained by:(Σ[hit]−Σ[errors])/(total possible successes/2]Spontaneously provide up to 3 names of MD (0–2 points, with 2 when: Hits – errors=3; 1 if it is 1 or 2, and 0 otherwise)Declare knowing “a lot/quite” of one of 9 most prevalent MD cited in the questionnaire: low back pain, arthritis, osteoarthritis, osteoporosis, rheumatoid arthritis, fibromyalgia, lupus, spondylitis and gout (0–2 points, and 0 when responding to 0, 1 if they intersect at 1, 2, 3 or 4, and 2 to more than 4)Recognize “much/a lot of” limitation of daily life, work and social activities, and purchasing power. (0–2 points, with 2 when recognized in more than 2)Score is added and becomes rate by dividing it by the maximum obtainable score (10) | Recognize in which age group (<45 years, 45–60, and >60 years) each of the nine MD is more prevalent (0–9 points)Recognize in which gender each of the nine MD is more prevalent (0–9 points)Provide up to 3 specific symptoms, according to the opinion of experts, for each of the 9 MD (0–3 points for each EME, 0–27 points in total)Score is added and becomes rate by dividing it by the maximum obtainable score (45) |
MD, musculoskeletal diseases.
A descriptive analysis and univariate associations were performed of composite indicators according to the sections of the questionnaire variables. The level of significance was P<.05. Subsequently, a multivariate analysis was performed by multiple linear regressions. It became a model for each synthetic indicator as the dependent variable in the analysis, including those variables that had statistical association in the univariate analysis.
ResultsAfter making 31289 phone calls and establishing contact in 13837 occasions the interview was conducted to 1009 subjects. Table 2 presents the description of the respondents according to sociodemographic variables. 51% of respondents were women and the most common age range was between 30 and 44 years (29.0%). The proportion of respondents was higher in the group with high school level (42.2%); those occupationally active (48.3%), among which the majority were qualified manual labor (42.8%), and residing in habitats of 10000–50000 inhabitants (24.6%).
Description of Respondents According to Sociodemographic Variables.
| Gender | Total | |||||
| Male | Female | |||||
| No. | % | No. | % | No. | % | |
| Age | ||||||
| 18–29 | 116 | 51.6 | 109 | 48.4 | 225 | 22.3 |
| 30–44 | 147 | 50.2 | 146 | 49.8 | 293 | 29.0 |
| 45–64 | 136 | 48.7 | 143 | 51.3 | 279 | 27.7 |
| 65+ | 91 | 42.9 | 121 | 57.1 | 212 | 21.0 |
| Total | 490 | 48.6 | 519 | 51.4 | 1009 | 100.0 |
| Habitat, no. inhabitants | ||||||
| Less than 10000 | 108 | 22.0 | 127 | 24.5 | 235 | 23.3 |
| From 10000 to 50000 | 127 | 25.9 | 121 | 23.3 | 248 | 24.6 |
| 50001 to 100000 | 50 | 10.2 | 61 | 11.8 | 111 | 11.0 |
| 100001–500000 | 130 | 26.5 | 109 | 21.0 | 239 | 23.7 |
| Over 500000 | 75 | 15.3 | 101 | 19.5 | 176 | 17.4 |
| Total | 490 | 48.6 | 519 | 51.4 | 1009 | 100.0 |
| Level of education completed | ||||||
| Uneducated | 21 | 4.3 | 32 | 6.2 | 53 | 5.3. |
| Primary | 132 | 27.0 | 174 | 33.5 | 306 | 30.4 |
| Middle school–high school | 209 | 42.7 | 216 | 41.6 | 425 | 42.2 |
| University | 127 | 26.0 | 97 | 18.7 | 224 | 22.2 |
| Total | 489 | 48.5 | 519 | 51.5 | 1008 | 100.0 |
| Current labor situation | ||||||
| Active | 294 | 60.0 | 193 | 37.2 | 487 | 48.3 |
| Unemployed | 55 | 11.2 | 65 | 12.5 | 120 | 11.9 |
| Retired/pensioner | 116 | 23.7 | 96 | 18.5 | 212 | 21.0 |
| Housewife | 0 | 0.0 | 123 | 23.7 | 123 | 12.2 |
| Student | 25 | 5.1 | 42 | 8.1 | 67 | 6.6 |
| Total | 490 | 48.6 | 519 | 51.4 | 1009 | 100.0 |
| Occupation (between assets/unemployed) | ||||||
| Unskilled manual | 48 | 13.8 | 34 | 13.2 | 82 | 13.5 |
| Qualified manual | 157 | 45.0 | 103 | 39.9 | 260 | 42.8 |
| Administrative | 34 | 9.7 | 58 | 22.5 | 92 | 15.2 |
| Directors | 8 | 2.3 | 7 | 2.7 | 15 | 2.5 |
| Professional | 79 | 22.6 | 43 | 16.7 | 122 | 20.1 |
| Business | 23 | 6.6 | 13 | 5.0 | 36 | 5.9 |
| Total | 349 | 57.5 | 258 | 42.5 | 607 | 100.0 |
The disease recognized by most respondents (60.3%) among the 3 most prevalent was myocardial infarction/angina, followed by cancer (60.0%) and low back pain (46.5%). Osteoarthritis and/or joint problems were recognized among the three most prevalent diseases by 35.6% of respondents and among the most disabling by 50.9%, while low back pain was recognized among the three most disabling 42, 8%. 79.2% recognized low back pain as the main cause of sick leave and 52.8% recognized osteoarthritis. In the responses to the variables related to social impact, the most recognized of the MD were related to impairment of earning capacity (91.5%) and social costs (72.1%), while 52.4% of respondents believe that MD were the most common diseases worldwide.
59.5% of the respondents knew something about MD, while 35.5% could not name any MD spontaneously. However, when asked about the list of 9 EME (Table 3), 981 persons reported having some knowledge about some of them (97.2%), although 84.5% of the respondents did not know anything about spondylitis and 87.5% knew nothing of lupus (which was not even named spontaneously). In the subgroup of 981 respondents who knew something of some MD, most recognized MD limited everyday life (93.6%), work (93.1%) and to a lesser extent, social life (73.4%) and purchasing power (64.7%) a lot or to some level. Given a list of suggested symptoms, over 90% associated joint pain, decreased mobility and joint inflammation with MD, while less than half considered them related to depression or anxiety disorders.
Identification and Knowledge of MD.
| Which MD(s) are you familiar with? Spontaneous replies | No. | % | Which one do you recognize as a MD? Responses from the questionnaire | How much do you know about it? | ||||||||
| Yes | No | DNK/NA | Little/Nothing | Pretty much/A lot | ||||||||
| No. | % | No. | % | No. | % | No. | % | No. | % | |||
| Low back pain | 168 | 28.0 | 748 | 74.1 | 209 | 20.7 | 52 | 5.2 | 774 | 70.0 | 331 | 30.0 |
| Osteoarthritis | 165 | 27.5 | 951 | 94.3 | 41 | 4.1 | 17 | 1.7 | 800 | 70.9 | 328 | 29.1 |
| Arthritis | 888 | 88.0 | 85 | 8.4 | 36 | 3.6 | 729 | 77.1 | 217 | 22.9 | ||
| Rheumatoid arthritis | 108 | 18.0 | 929 | 92.1 | 34 | 3.4 | 46 | 4.6 | 620 | 78.2 | 173 | 21.8 |
| Osteoporosis | 75 | 12.5 | 765 | 75.8 | 163 | 16.2 | 81 | 8.0 | 678 | 76.3 | 211 | 23.7 |
| Rheumatisma | 64 | 10.7 | – | – | – | – | – | – | – | – | – | – |
| Fibromialga | 45 | 7.5 | 489 | 48.5 | 276 | 27.4 | 244 | 24.2 | 501 | 77.7 | 144 | 22.3 |
| Spondylitis | 13 | 2.2 | 222 | 22.0 | 243 | 24.1 | 544 | 53.9 | 175 | 84.5 | 32 | 15.5 |
| Herniated disk | 13 | 2.2 | – | – | – | – | – | – | – | – | – | – |
| Sciatica | 12 | 2.0 | – | – | – | – | – | – | – | – | – | – |
| Tendinitis | 9 | 1.5 | – | – | – | – | – | – | – | – | – | – |
| Gout | 7 | 1.2 | 417 | 41.3 | 494 | 49.0 | 98 | 9.7 | 682 | 78.5 | 187 | 21.5 |
| Do not know/other | 213 | 35.5 | – | – | – | – | – | – | – | – | – | – |
| Lupus | – | – | 83 | 8.2 | 446 | 44.2 | 480 | 47.6 | 224 | 87.5 | 32 | 12.5 |
MD, musculoskeletal diseases; NS/NC, do not know/no answer.
These same subjects answered questions on specific aspects of knowledge of MD, information that was transformed and quantified in the SK indicator. They also rated the quality of their information, most of them considering it poor or very poor (54.5%). The information available was considered as sufficient when referring to ‘what is’ the disease (71.3%), while considered only sufficient when referring to the drugs and their side effects in 37.3 and 31.6%, respectively.
According to the MD presentation in them or their families, 93.8% of respondents recognized MD due to their own condition (52.5%) and/or a relative/friend's (84.4%) (Table 4). Of these, 70% said that MD limited the daily activity of the sufferer. Asked what professional should deal with MD, most responded that they should be treated by rheumatologists (68.8%) followed by trauma specialists (21.3%).
MD Presented by the Respondent or Family (no.=1.009).
| Do you know someone who has or has had…? | ||||||||
| No | Only yourself | Only some friend/family | You and friend/family | |||||
| No. | % | No. | % | No. | % | No. | % | |
| Low back pain | 294 | 29.1 | 218 | 21.6 | 357 | 35.4 | 140 | 13.9 |
| Arthritis | 562 | 55.7 | 62 | 6.1. | 351 | 34.8 | 34 | 3.4 |
| Osteoarthritis | 363 | 36.0 | 117 | 11.6 | 478 | 47.4 | 51 | 5.1 |
| Fibromyalgia | 745 | 73.8 | 23 | 2.3 | 237 | 23.5 | 4 | 0.4 |
| Chronic back pain | 482 | 47.8 | 158 | 15.7 | 321 | 31.8 | 48 | 4.8 |
| Gout | 612 | 60.7 | 32 | 3.2 | 354 | 35.1 | 11 | 1.1 |
| Others | – | – | – | – | – | – | 11 | 1.1 |
| Any of the abovea | 63 | 6.2 | 94 | 9.3 | 416 | 41.2 | 436 | 43.2 |
MD, musculoskeletal diseases.
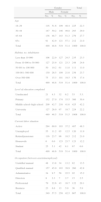
Table 5 describes the synthetic indicators of knowledge of MD and their distribution according to sociodemographic variables. SIK level was acceptable, with 75% of the sample with a score above 0.5 over 1. The average level of knowledge is 0.62±0.16, being the indicator which obtained the highest scores regarding knowledge. GK level had an average value of 0.50±0.17 and SK was 0.18±0.10, exhibiting low values compared with other synthetic indicators of specific knowledge. The indicators were correlated with each other, with the association between GK and SK being greater (ρ=0.547). SIK had significantly higher values in men (0.64 versus 0.61 in women) and retirees (0.65). GK was higher in women (0.52), in those aged between 30 and 44 years (0.53), among the inhabitants of towns with fewer than 100000 inhabitants (0.50), those with higher educational level (0.52), and those without a professional occupation of manual laborer (>0.50). TSK was higher in women, middle-aged people with higher levels of education and non-manual occupations (P<.001 in all). The association with work status resembled the association with age, being lower for retirees (older) and students (younger).
Synthetic Indicators of the Level of Knowledge of MD. Breakdown by Socio-demographic Variables.
| Synthetic indicator of knowledge | No. | Mean | SD | Min. | P25 | Median | P75 | Max. | Correlations | |||
| IS | CG | |||||||||||
| ρ | P | ρ | P | |||||||||
| Social impact (SIK) | 1.009 | 0.62 | 0.16 | 0.14 | 0.50 | 0.64 | 0.71 | 1.00 | – | – | ||
| General (GK) | 1.009 | 0.50 | 0.17 | 0.00 | 0.38 | 0.51 | 0.61 | 0.93 | 0.229 | .000 | – | |
| Specific (SK) | 1.009 | 0.18 | 0.10 | 0.00 | 0.11 | 0.18 | 0.24 | 0.51 | 0.165 | .000 | 0.547 | .000 |
| Social impact | General knowledge | Specific knowledge | ||||||||||
| No. | Mean | SD | P | No. | Mean | SD | P | No. | Average | DE | P | |
| Sexa | ||||||||||||
| Male | 490 | 0.64 | 0.15 | .001 | 490 | −0.47 | 0.18 | .000 | 490 | 0.17 | 0.10 | .000 |
| Female | 519 | 0.61 | 0.16 | 519 | 0.52 | 0.17 | 519 | 0.19 | 0.10 | |||
| Age, yearsb | ||||||||||||
| 18–29 | 225 | 0.62 | 0.15 | NS | 225 | 0.46 | 0.17 | .000 | 225 | 0.16 | 0.10 | .000 |
| 30–44 | 293 | 0.62 | 0.16 | 293 | 0.53 | 0.16 | 293 | 0.20 | 0.10 | |||
| 45–64 | 279 | 0.62 | 0.15 | 279 | 0.51 | 0.17 | 279 | −0.21 | 0.10 | |||
| 65+ | 212 | 0.64 | 0.18 | 212 | −0.47 | 0.18 | 212 | 0.14 | 0.09 | |||
| Habitatb | ||||||||||||
| Less than 10000 | 235 | 0.63 | 0.16 | NS | 235 | 0.50 | 0.16 | .051 | 235 | 0.17 | 0.10 | .046 |
| From 10000 to 50000 | 248 | 0.63 | 0.15 | 248 | 0.52 | 0.18 | 248 | 0.18 | 0.10 | |||
| 50000–100000 | 111 | 0.64 | 0.17 | 111 | 0.51 | 0.15 | 111 | 0.20 | 0.10 | |||
| 100000–500000 | 239 | 0.62 | 0.16 | 239 | −0.47 | 0.19 | 239 | 0.17 | 0.10 | |||
| Over 500000 | 176 | 0.61 | 0.16 | 176 | −0.49 | 0.17 | 176 | 0.19 | 0.10 | |||
| Educational levelb | ||||||||||||
| Uneducated | 53 | 0.62 | 0.17 | NS | 53 | 0.41 | 0.18 | .000 | 53 | 0.11 | 0.09 | .000 |
| Primary | 306 | 0.64 | 0.16 | 306 | 0.48 | 0.18 | 306 | 0.15 | 0.09 | |||
| Medium–high school | 425 | 0.62 | 0.16 | 425 | 0.50 | 0.17 | 425 | 0.19 | 0.10 | |||
| University | 224 | 0.62 | 0.15 | 224 | 0.52 | 0.15 | 224 | 0.22 | 0.10 | |||
| Employment statusb | ||||||||||||
| Active | 487 | 0.62 | 0.15 | .037 | 487 | 0.51 | 0.17 | NS | 487 | 0.19 | 0.10 | .00 |
| Unemployed | 120 | 0.61 | 0.15 | 120 | −0.49 | 0.17 | 120 | 0.18 | 0.10 | |||
| Retired or pensioner | 212 | 0.65 | 0.17 | 212 | 0.48 | 0.19 | 212 | 0.5 | 0.10 | |||
| Housewife | 123 | 0.62 | 0.17 | 123 | 0.51 | 0.16 | 123 | 0.19 | 0.09 | |||
| Student | 67 | 0.59 | 0.14 | 67 | 0.45 | 0.18 | 67 | 0.16 | 0.11 | |||
| Occupation (if active/unemployed)b | ||||||||||||
| Unskilled manual | 82 | 0.62 | 0.14 | NS | 82 | 0.45 | 0.19 | .001 | 82 | 0.15 | 0.09 | .000 |
| Qualified manual | 260 | 0.63 | 0.16 | 260 | −0.49 | 0.16 | 260 | 0.18 | 0.10 | |||
| Administrative | 92 | 0.60 | 0.17 | 92 | 0.54 | 0.17 | 92 | −0.21 | 0.10 | |||
| Directors | 15 | 0.63 | 0.16 | 15 | 0.58 | 0.13 | 15 | 0.23 | 0.09 | |||
| Professional | 122 | 0.62 | 0.15 | 122 | 0.53 | 0.16 | 122 | −0.21 | 0.11 | |||
| Business | 36 | 0.62 | 0.13 | 36 | 0.52 | 0.17 | 36 | −0.21 | 0.09 | |||
SD, standard deviation; MD, musculoskeletal diseases; Max., maximum; Min., minimum; NS, not significant; P25, 25th percentile; P75, 75th percentile; P, level of statistical significance; ρm Pearson correlation coefficient.
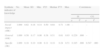
Table 6 shows the multiple linear regression models of composite indicators. The SIK model explains about 10% of the variability of the indicator (r2=0.095). The greater the SIK was the greater is the GK and SK (maintaining this variable in the model to improve the explanatory power, even if their level of significance exceeded 0.05). It was higher in men, retirees and residents of less populated localities (maintained in the model to improve the explanatory power). It was also higher among those who considered themselves sufficiently informed as to “anything general” concerning MD, who had experience with limitations of daily life AND TO to those who have MD and, more specifically, arthritis and/or know someone that had it (kept in the model to improve the explanatory power).
Multiple Linear Regression Models of Composite Indicators.
| Variables | Beta coefficient | P | 95% for Beta | R2 | |
| LI | LS | ||||
| Model for the dependent variable knowledge of synthetic indicator of social impact of the MD (SIK) | |||||
| (Constant) | 0.476 | .000 | 0.435 | 0.516 | 0.095 |
| Synthetic indicator general knowledge | 0.128 | .001 | 0.054 | 0.201 | |
| Synthetic indicator specific knowledge | 0.108 | .075 | −0.011 | 0.227 | |
| Male | 0.044 | .000 | 0.024 | 0.063 | |
| Retired | 0.032 | .019 | 0.005 | 0.058 | |
| Have you or someone you know had any MD and has been limited in their daily lives? | 0.028 | .014 | 0.006 | 0.050 | |
| Do you consider you are sufficiently generally informed as to all MD | 0.022 | .042 | 0.001 | 0.042 | |
| Do you know someone with osteoarthritis | 0.018 | .098 | −0.003 | 0.040 | |
| Do they present one of the 6 MD | 0.010 | .049 | 0.000 | 0.020 | |
| Habitata | −0.006 | .086 | −0.013 | 0.001 | |
| Model for the dependent variable synthetic indicator of general knowledge of EMDE (GK) | |||||
| (Constant) | 0.234 | .000 | 0.191 | 0.277 | 0.355 |
| Synthetic indicator specific knowledge | 0.783 | .000 | 0.690 | 0.876 | |
| synthetic indicator of social impact Knowledge | 0.107 | .000 | 0.050 | 0.165 | |
| Do you or someone you know have had any MD limiting their daily lives? | 0.033 | .001 | 0.014 | 0.053 | |
| Do you know someone else who has back pain | 0.023 | .036 | 0.002 | 0.044 | |
| Do you know someone else who has chronic back pain | 0.023 | .015 | 0.004 | 0.041 | |
| Do they present one of these 6 MD | 0.020 | .000 | 0.011 | 0.028 | |
| Do you present or know someone else who has arthritis | 0.017 | .062 | −0.001 | 0.035 | |
| Habitata | −0.006 | .050 | −0.012 | 0.000 | |
| Male | 0.016 | .076 | −0.034 | 0.002 | |
| Comments that PC doctor is the one who must deal with MD | −0.029 | .099 | −0.064 | 0.006 | |
| Model for the dependent variable synthetic indicator of specific knowledge of the MD (SK) | |||||
| (Constant) | 0.044 | .003 | −0.072 | −0.015 | |
| Synthetic indicator general knowledge | 0.243 | .000 | 0.212 | 0.274 | |
| synthetic indicator of social impact knowledge | 0.054 | .001 | 0.022 | 0.086 | |
| Highest level of education completeda | 0.027 | .000 | 0.021 | 0.033 | |
| Presents or know someone else who has fibromyalgia | 0.025 | .000 | 0.013 | 0.038 | |
| Age recordedc | 0.013 | .000 | 0.007 | 0.020 | |
| knows someone that has one of the 6 MD | 0.009 | .000 | 0.005 | 0.013 | |
| Presents or knows someone else who has chronic back pain | 0.010 | .067 | 0.020 | 0.001 | |
| Male | 0.016 | .002 | −0.026 | −0.006 | |
| Comments that it is the orthopedist who must deal with MD | −0.026 | .000 | −0.038 | 0.014 | |
| Do not know/no answer which doctor should treat MD | −0.035 | .014 | 0.063 | 0.007 | |
| Retired | −0.035 | .000 | −0.051 | −0.019 | |
MD, musculoskeletal diseases; 95%, confidence interval 95%; LI, lower limit; LS, upper limit; P, level of statistical significance.
The GK model explains 35.5% of its variability. GK increases with increasing SK and SIK as well as in patients with any of the 6 MD shown in Table 4, and even more so if they have had or knew someone who had had back pain, chronic back pain or arthritis. It was higher among those who were aware that MD presented a limitation for everyday life activities. However, the level of awareness was lower in men, in the most populated areas and in those who thought that the primary care physician was the one that should look after MD.
The SK model explains 42.6% of the variability. SK improved by improving GK and SIK and was greater the higher the age or educational level, whether the respondent knew someone who had a MD included in Table 3, especially if the disease was fibromyalgia, in the person or their acquaintances. SK was worse in men, retirees, when the disease was chronic back pain or if no answer was provided as to who should treat MD or if they think that it should be the trauma specialist.
DiscussionThis study is an approach to assess the level of knowledge of the Spanish population on MD. The information collected relates to knowledge of social and general knowledge of all the MD, specific or more prevalent MD. With this, secondary indicators were constructed on the knowledge level, quantified in 3 different planes, SIK, GK and SK, used to study its association with other variables.
According to the results, the level of knowledge of the Spanish population of the SIK in MD can be considered medium–high, the GK corresponds to an average level and the SIK to a limited level. The level of knowledge depends on the individual sociodemographic factors and personal experience with the presentation of MD, by the persons themselves or through acquaintances.
So, between sociodemographic factors, men scored higher in SIK, perhaps because this indicator inquired about labor and employment status and is a variable associated with the gender. However, most women know more on MD at the GK and SK levels, probably because, taken together, they present MD to a greater extent. Age was directly associated to a higher SK, since the probability of patients who have experienced or know someone who has experienced MD increases with age, and indirectly, SIK and SK levels were higher through the significance of the effect of being retired. A higher level of education was associated with improved SK, which is consistent with other studies4,6 and the fact that the questions that make up this indicator were accurate, not related to general education and required a degree of education or experience. Finally, living in smaller populations is associated with increased SIK and GK.
As for personal experience, the SIK and GK levels are higher among those with MD, increasing with the experience, and for those who are limited in their daily lives because of them. SK is not associated with personal experience perhaps because it is unlikely that a person is exposed to over 2 MD (almost half of respondents did not have any, and just over a fifth had more than one). Instead, SK increases by increasing the number of persons who experienced MD indirectly by knowing persons who presented them. In fact, two-thirds of respondents knew at least 2 persons who had different MD, and less than half knew of at least 3 patients with different MD.
According to the MD in question, experience, direct and indirect, of its presentation is associated differently with knowledge levels. Osteoarthritis was associated with a higher level of SIK, arthritis, low back pain and chronic back pain were associated with a higher level of GK, and fibromyalgia was associated with higher levels of SK, perhaps because the MD whose knowledge is less common is more discriminating in this indicator. Paradoxically, the experience related to chronic back pain was associated with lower levels of SK, perhaps because of the vagueness in the wording of the MD or that back pain is so prevalent that it is part of popular tradition.
Knowledge levels studied were correlated, with no collinearity, and covered different aspects with a different scope. Knowledge was vaguer, more widespread, and reaching higher scores is the SIK. In contrast, the SK, which refers to a better and more specific understanding, was less widespread and got worse scores.
Comparison with other studies is difficult because of the different designs and methodologies used in the literature. In this study, its design and methodology were determined by a different starting approach. For example, the target population is the general population, with and without MD while most studies focus on specific MD1,2,4 concrete MD or, conversely, in population free of MD.3 There are general population studies, but they are usually designed as educational interventions.5 The fundamental difference with other studies is the operational definition of “knowledge of MD” and, consequently, the nature of the results. The knowledge explored in this study refers to the socio-labor aspects and knowledge that people have of the MD epidemiological phenomenon (population) and its symptoms and consequences. Other studies, however, by addressing patients, have explored the knowledge of clinical aspects (etiology, pathophysiology, diagnosis, treatment and prophylaxis).2,3,5,7
The construction of synthetic indicators of level of knowledge, of which there is no precedent in the literature, limits the comparability of results. However, the usefulness of the indicators shows the extent to which they serve to synthesize, describe and interpret the information gathered and allow us to study the variability of the population according to them. The indicators have been constructed with a methodology that allows replication, according to the criteria of experts in MD, and satisfactorily describes the population according to the objectives. However, the variability explained by the multivariate models is limited. This suggests that the residual variability may be due to other variables not included in the models or different determinants on which information was not collected.
In short, the Spanish population has a medium level of knowledge of the importance of MD in terms of frequency and the way they affect the performance of the activities of those who have them, and identify them sufficiently, knowing their symptoms broadly, but know little about them individually. The level of knowledge varies according to sociodemographic factors and direct and indirect experience with MD presentation.
Ethical ResponsibilitiesProtection of people and animalsThe authors declare that this research has not been done in humans or animals.
Data confidentialityThe authors state that no patient data appear in this article.
Right to privacy and informed consentThe authors state that no patient data appear in this article.
FundingThis research was funded by Abbott Foundation. The work of Juan Angel Jover and Rosario García-Vicuña was partially funded by the RETICS, RD08/0075 (RIER) research program of the Instituto de Salud Carlos III (ISCIII).
Conflict of interestNo author has a conflict of interest.
Please cite this article as: Lázaro P, et al. Conocimiento de la población española de las enfermedades músculo-esqueléticas. Reumatol Clin. 2013;9:274–280.