


Rheumatic diseases are the most frequent cause of non-malignant chronic pain. In recent years, pain and its management have become more important in rheumatology.
ObjectivesTo estimate the prevalence and characteristics of pain associated with rheumatic pathology treated in rheumatology clinics in Spain, as well as their treatment and response to it.
MethodsMulticentre observational study with two phases (cross-sectional and prospective). Variables were collected from the doctor, patient, pain and its management, comorbidities, therapeutic response and related psychosocial aspects. The differences between de novo (NP) vs. follow-up (FP) patients were analyzed.
Results34 centres and 1084 patients were included, 32% NP and 68% FP. Pain was present in 86%, was chronic in 81% and neuropathic in 12% of the surveyed population. Fifty percent of the patients would regard their pain as tolerable if its intensity according to the visual numeric scale (VNS) was ≤2. Among the FP it was more frequent to have the perception of controlled pain (65.5% vs. 49.4%) and to be satisfied with the treatment (53.3% vs. 35.6%). Of these patients, 23.5% had been treated with opioids in the previous month.
ConclusionsIn the last decade, the prevalence of pain in rheumatology in Spain remains high, although it has diminished. The use of opioids, on the other hand, has increased.
Las enfermedades reumáticas son la causa más frecuente de dolor crónico no maligno. En los últimos años, el dolor y su manejo han cobrado mayor relevancia en reumatología.
ObjetivosEstablecer la prevalencia y las características del dolor asociado a enfermedad reumática atendido en consultas de Reumatología de nuestro país, así como de su tratamiento y la respuesta a este.
MétodosEstudio multicéntrico observacional con 2 fases, una transversal y otra prospectiva. Se recogieron variables del médico, paciente, dolor y su manejo, comorbilidades, respuesta terapéutica y aspectos psicosociales relacionados. Se analizaron las diferencias entre pacientes nuevos y en revisión (PR).
ResultadosSe incluyeron 34 centros y 1.084 pacientes, 32% pacientes nuevos y 68% PR. En general, el dolor estaba presente en el 86% de los pacientes, era crónico en el 81% y neuropático en un 12%. El 50% de los pacientes consideraría el dolor aceptable cuando la intensidad en la escala visual numérica fuese ≤2. Entre los PR existía mayor percepción de dolor controlado (65,5 % vs. 49,4%) y satisfacción con el tratamiento (53,3% vs. 35,6%). El 23,5 % estaba en tratamiento con opioides en el mes previo.
ConclusionesEn la última década, la prevalencia de dolor en el ámbito reumatológico en nuestro país persiste elevada, aunque ha disminuido. El empleo de opioides, por otra parte, ha aumentado.
The rheumatic diseases are the most frequent cause of non-malign pain.1,2 18.29% of the Spanish population stated that they have been diagnosed with arthritis, arthrosis or rheumatism, and 34.49% suffer chronic back pain (cervical or lumbar), at a higher rate of prevalence than any other chronic process, according to the National Health Survey by the Instituto Nacional de Estadística.3 Pain is the chief and most common symptom in these complaints, and the two terms pain-rheumatic process cover important levels of comorbidity, loss of functional capacity, occupational disability and a fall in quality of life.4–8
Few epidemiological studies have evaluated the potential relationship between pain, rheumatic disease, functional capacity and quality of life, especially within the rheumatological field. Only the EPIDOR study of 20025 analysed aspects connected with pain in rheumatic disease in rheumatology outpatient surgeries. It showed that pain was present in 95% of cases—80% of which were chronic—, with a notable affect on quality of life, while 40% of patients had unsatisfactory control of pain and opioid usage was lower than 5%. Likewise, 40% and 15% of cases had mild to moderate depression, respectively.
Since then pain has become more relevant in the medical and scientific world in general. Moreover, new knowledge in the field of pain, systematic reviews of therapeutic interventions and analgesic usage guides9–14 should have contributed to better control of pain within our field, although this has never been evaluated in any way. On the other hand, the EPIDOR5 study was unable to assess certain interesting aspects because it was a transversal study, while other aspects were not covered (neuropathic pain, the detection of uncontrolled pain parameters and clinically relevant responses).
All of the above considerations justify undertaking a new epidemiological study of pain in rheumatic disease treated by rheumatologists, with the following aims: to estimate the prevalence and characteristics of pain associated with rheumatic disease seen in rheumatology surgeries in our country; to describe its associated psychosocial aspects, quality of life and occupational disability; to describe the degree of satisfaction with treatment and the degree to which pain is controlled; to evaluate the differences between patients who visit the surgery for the first time and those who come in for check-ups, and to identify any clinically relevant changes, as well as the variable which is associated with them the most closely. In this paper we will limit ourselves to descriptive analysis and comparison between new patients and those being monitored for each variable analysed.
Patients, material and methodsOverall design: a multicentre observational study in 2 phases, one transversal and the other prospective.
Study population and participant selectionData were gathered in 34 hospitals—as 6 of the 40 hospitals chosen initially decided not to take part—, selected on the basis of their excellence when taking part in previous research projects and their interest in studies of this type. The criterion of geographical distribution was also taken into account, so that they were a representative sample of national territory.
Patients were included who were being treated in rheumatology surgeries that were not specialised in a single field, and those for whom recording information reliably would have been impossible were excluded (due to dementia, difficulty in understanding the questions, a lack of linguistic fluency, etc.) or patients with previous trauma that was the main cause of pain and that was not associated with their rheumatic disease.
Patients were selected according to the randomisation list sent to each hospital, based on the order in which they were seen in the surgery. This list was prepared in a centralised way and consisted of 50 randomly selected numbers from 1 to 200. If the corresponding patient fulfilled the selection criteria, they were asked to take part. If they refused to take part, they were replaced by the following patient on the random list. 30 patients per hospital were included (this number having been set for reasons of convenience, as a total sample of 1200 patients would make it possible to estimate prevalences and compare subgroups as well as making comparisons with data from the EPIDOR study). The distribution of new patients (PN) and those in follow-up (PR) included in each hospital was such that it approximately represents the ratio in a typical rheumatology surgery (where the ratio of new patients to patients in follow-up = 1:2).
This study was approved by the clinical research ethics committees and management bodies of all the participating hospitals, and it was undertaken according to the principles of the Helsinki Declaration and the International Guidelines for Ethical Review of Epidemiological Studies (Council for the International Organizations of Medical Sciences-Geneva, 1991). All of the subjects included gave their informed consent prior to taking part in the study.
Study visits and variablesThe doctor completed a standardised questionnaire in each visit, and the patients completed a series of self-administered questionnaires. The second visit took place for those subjects who in their first visit had referred moderate to severe pain, or pain that was insufficiently controlled (pain ≥ 4 on the numerical pain scale), on condition that they had been prescribed a new treatment, modified their existing treatment or were waiting for their prescribed treatment to bring about changes within the short term. This second visit had to take place from one to 3 months after the first one, at the moment when it was estimated that pain should have been controlled or, at least when it was possible to definitively assess the response to the prescribed treatment.
Fieldwork took place from October 2012 to July 2013.
The variables included were:
- -
Sociodemographic characteristics of the doctor and patient. Lifestyle habits of the latter.
- -
Date symptoms commenced, reason for visiting (PN or PR for check-up), follow-up time in rheumatology.
- -
Associated diseases (cardiovascular, respiratory, digestive, neurological, psychiatric, metabolic, kidney disease) and treatment.
- -
Pain characteristics: duration, location (pain was considered to be generalised when it was located above and below the waist and on both sides of the body), the diagnosis of its cause, type and pattern, intensity and degree of interference–measured on the numerical visual scale ([NVS] used in its printed version, in which 0—no pain—up to 10—the worst imaginable pain—in a horizontal layout that was standardised in all of the hospitals)15 and a short questionnaire to evaluate the pain (BPI)16 and a neuropathic pain diagnostic questionnaire.8
- -
Pain management: the treatment patients had been prescribed or had received during the month prior to their visit was described, together with the treatment prescribed by the rheumatologist in the basal visit. Information was recorded about the pharmacological analgesic treatment itself (simple analgesics, NSAID, COX-2, minor and major opioids, capsaicin and others), coadjuvants (differentiating between antidepressive drugs, anticonvulsants, muscle relaxants, local anaesthetics, SYSADOA, corticoids, DMD, biologicals, botulinum toxin and others) and interventionist techniques (including corticoid infiltrations, synoviorthesis, radiofrequency, ozone therapy, intra-articular hyaluronate and others). Information was also recorded about non-pharmacological treatment of any type (patient education, psychotherapy, relaxation, physical activity, rehabilitation, physiotherapy, hydrotherapy, masotherapy, chiropraxis, osteopathy, electrotherapy, TENS, acupuncture, homeopathy and others).
- -
Therapeutic adherence to the treatment prescribed in the basal visit (evaluated by the rheumatologist in the follow-up visit).
- -
Evaluation of clinical response: on the overall clinical impression of change scale,17 with a specific question about controlled pain, a question about whether the therapeutic response was sufficient to live a normal life, and a question about self-perceived controlled pain in comparison with previous pain.
- -
Quality of life—using the SF1218 questionnaire, catastrophysing—using the Spanish version of the Pain Catastrophising Scale (PCS)19—, effect on mood—using the hospital anxiety and depression scale (HADS)20 and the Zung scale.21
Descriptive analysis was performed, calculating the absolute and relative frequency for the qualitative variables, and the average and standard deviation (SD) or median and interquartile range (IR) for the quantitative variables, depending on whether or not they were distributed normally. The differences between PN and PR were then analysed using the Student t-test for quantitative variables or non-parametric tests if normalcy could not be assumed, and the Chi–squared test corrected for Yates or Fisher continuity in 2:2 tables for qualitative variables.
P < .05 was considered statistically significant. The SPSS 21.0 program for Windows was used for statistical analysis.
ResultsPatient recruitment and sample composition according to type of visitAlthough at first the number of patients had been set at 30 per hospital for the total sample, when the number of participating hospitals was reduced, others were requested to increase the number of patients they included to compensate for the loss.
Recruitment took place in accordance with the protocol, including consecutive patients as specified by the randomisation table. A total of 1084 patients were recruited. Of the 1075 for whom the type of visit is known, 342 (32%) were PN and 733 (68%) were PR.
50% of the patients had visited the surgery at least twice during the previous year (IR 1–3) and had been in follow-up for at least 34 months (IR 3–94) (Fig. 1) for the distribution of the sample according to hospital.
Results of the basal visit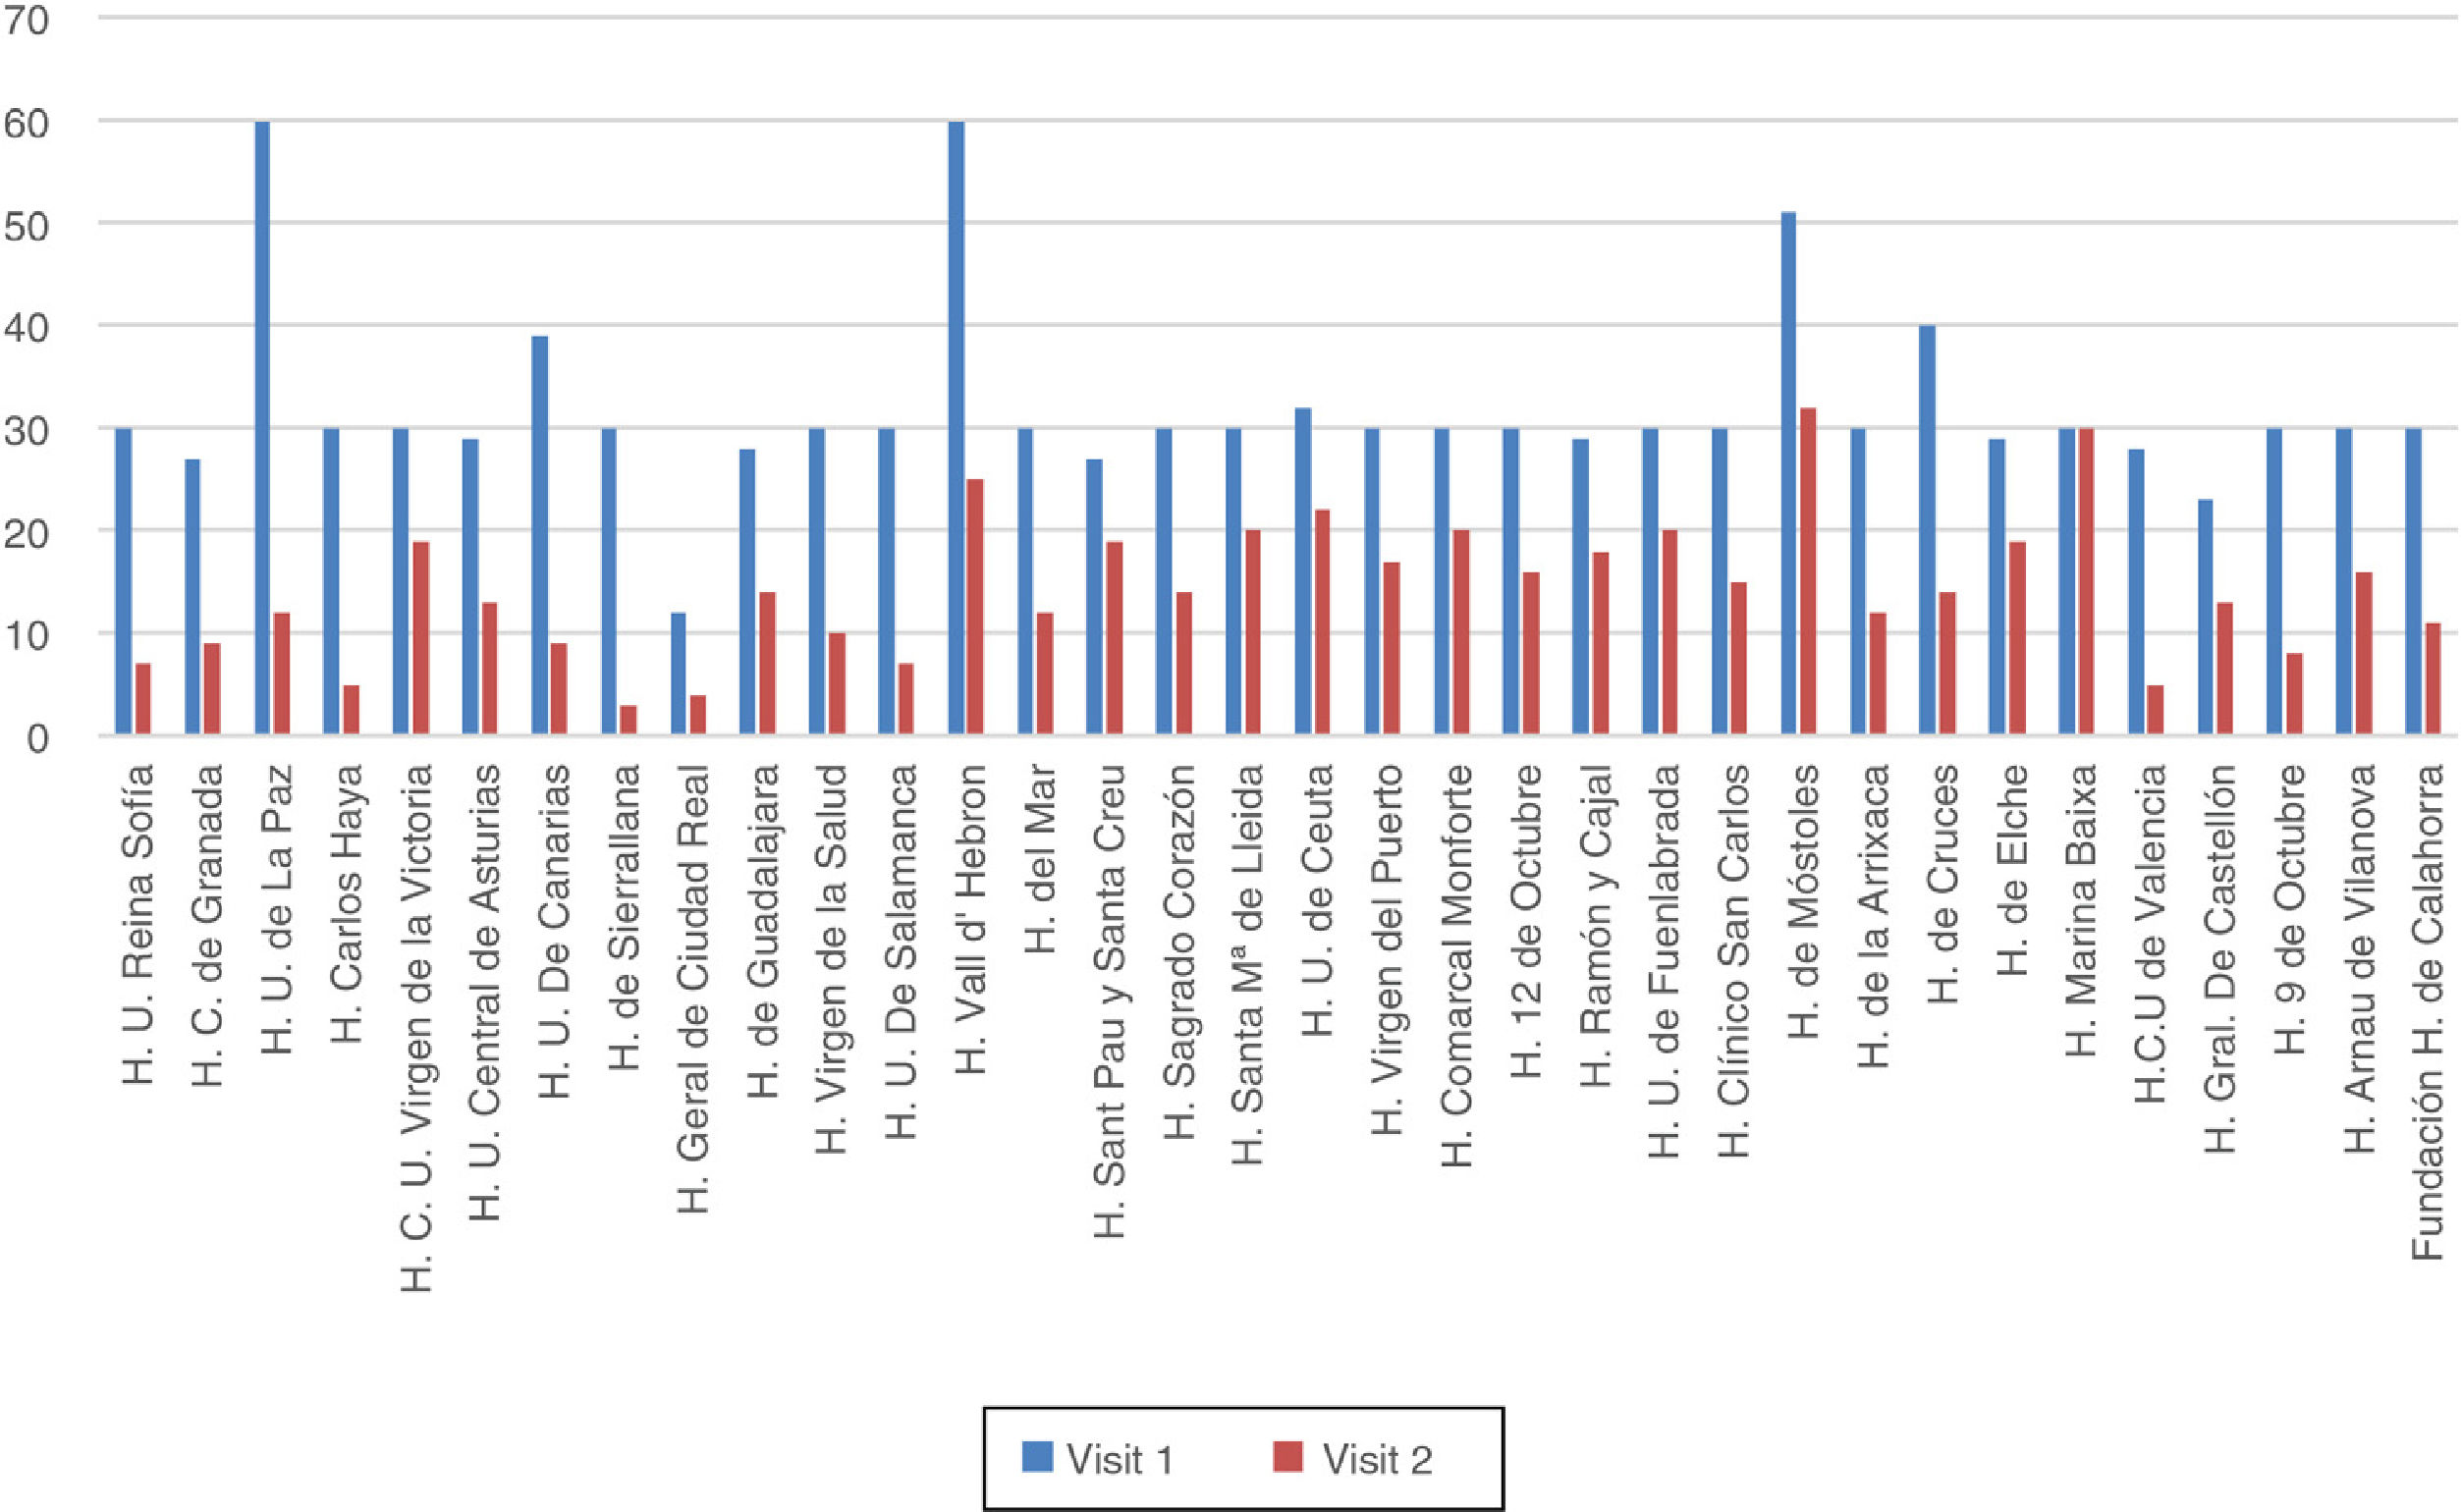
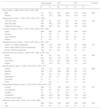
Data corresponding to the sociodemographic and occupational variables are shown in Table 1. Regarding occupational disability, there was a significantly higher rate of recognised permanent disability among the patients who visited for a check-up (8.8% in PN; 17.3% in PR).
Sociodemographic data. Basal visit.
| Total sample | PN | PR | P value* | ||||
|---|---|---|---|---|---|---|---|
| N | % | N | % | N | % | ||
| Sex (n total = 1,068; n PN = 336; n PR = 725) | |||||||
| Men | 311 | 29.1 | 98 | 29.2 | 213 | 29.4 | .994 |
| Women | 757 | 70.9 | 238 | 70.8 | 512 | 70.6 | |
| Age groups (n total = 1,075; n PN = 338; n PR = 729) | |||||||
| 19 to 45 years | 237 | 22 | 68 | 20.1 | 167 | 22.9 | .154 |
| 46 to 65 years | 529 | 49.2 | 181 | 53 | 344 | 47.2 | |
| Older than 65 years | 309 | 28.7 | 89 | 26.3 | 218 | 29.9 | |
| Country of origin (n total = 1,033; n PN = 329; n PR = 700) | |||||||
| Spain | 986 | 95.5 | 318 | 96.7 | 664 | 94.9 | |
| Europe | 9 | 0.9 | 2 | 0.6 | 7 | 1.0 | |
| Latin America | 34 | 3.3 | 8 | 2.4 | 26 | 3.7 | |
| Others | 4 | 0.4 | 1 | 0.3 | 3 | 0.4 | |
| Residential area (n total = 1,054; n PN = 333: n PR = 714) | |||||||
| Urban (> 10,000 inhabitants) | 829 | 78.7 | 250 | 75.1 | 574 | 80.4 | .147 |
| Semi-urban (5000-10,000 inhabitants) | 122 | 11.6 | 45 | 13.5 | 75 | 10.5 | |
| Rural (< 5000 inhabitants) | 103 | 9.8 | 38 | 11.4 | 65 | 9.1 | |
| Educational level (n total = 1,060; n PN = 336; n PR = 721) | |||||||
| None | 98 | 9.2 | 26 | 7.7 | 72 | 10.0 | .493 |
| Primary | 601 | 56.7 | 187 | 55.7 | 412 | 57.1 | |
| Secondary | 189 | 17.8 | 63 | 18.8 | 126 | 17.5 | |
| Higher | 172 | 16.2 | 60 | 17.9 | 111 | 15.4 | |
| Marital status (n total = 1,048; n PN = 327; n PR = 717) | |||||||
| Single | 118 | 11.3 | 39 | 11.9 | 79 | 11.0 | .886 |
| Married | 762 | 72.7 | 238 | 72.8 | 521 | 72.7 | |
| Widow | 112 | 10.7 | 34 | 10.4 | 78 | 10.9 | |
| Separated | 27 | 2.6 | 6 | 1.8 | 21 | 2.9 | |
| Divorced | 21 | 2 | 7 | 2.1 | 14 | 2.0 | |
| Other | 8 | 0.8 | 3 | 0.9 | 4 | 0.6 | |
| Occupational status (n total = 1,070; n PN = 338; n PR = 727) | |||||||
| In work | 396 | 37 | 120 | 35.5 | 274 | 37.7 | .041 |
| Unemployed | 95 | 8.9 | 39 | 11.5 | 56 | 7.7 | |
| Student | 15 | 1.4 | 8 | 2.4 | 7 | 1.0 | |
| Housewife | 266 | 24.9 | 89 | 26.3 | 176 | 24.2 | |
| Retired or pre-retired | 298 | 27.9 | 82 | 24.3 | 214 | 29.4 | |
| Off work (n total = 981; n PN = 313; n PR = 663) | |||||||
| No | 936 | 95.4 | 296 | 94.6 | 636 | 95.9 | .340 |
| Yes | 45 | 4.6 | 17 | 5.4 | 27 | 4.1 | |
19% were habitual smokers—53.6% had never smoked—and 72.8% never or hardly ever consumed alcohol—frequent alcohol consumption was very rare (less than 1%)—. A high proportion of patients had a sedentary lifestyle—22.5% had not carried out any free time physical activity in the previous 6 months—. No statistically significant differences were found between PN and PR.
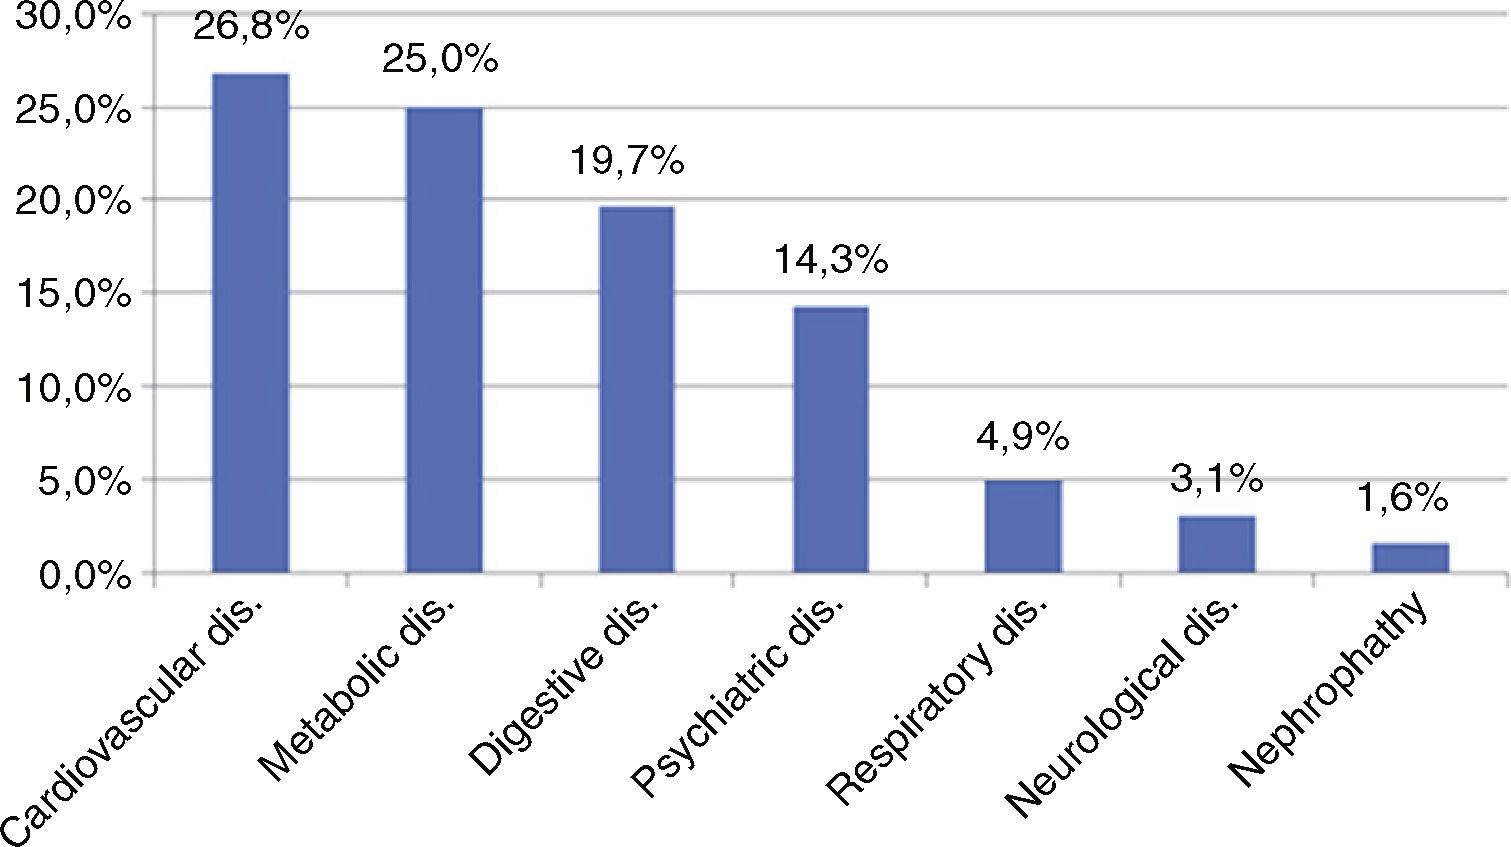
Fig. 2 shows patient comorbidities. Arterial hypertension (25.6%) and hypercholesterolaemia (19.4%) were the most frequent risk factors. No statistically significant differences were found between PN and PR in terms of comorbidity frequency except for digestive disease, which was more prevalent in the latter (15.5% vs. 22.0%, respectively).
64.7% had a high probability of developing anxiety and 22.0% had a high probability of depression (significantly higher in PN than in PR; 26.5% and 19.7%, respectively). 23% had clinically relevant catastrophisation (score ≥ 30 on the PCS)22 and their health-related quality of life (according to their SF-12 score) was worse physically (average score 37.5 [SD: 10.6]) and mentally (44.9 [SD: 13.17]) than the reference population, without any significant difference here between PN and PR.
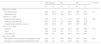
The prevalence and intensity of pain are shown in Table 2.
Prevalence and intensity of pain.
| Total sample | PN | PR | P value * | ||||
|---|---|---|---|---|---|---|---|
| N | % | N | % | N | % | ||
| Pain during the last week (n = 1,056) | 905 | 85.7 | 294 | 88.6 | 605 | 84.3 | .065 |
| Pain at some time during the disease (n = 1.084) | 1044 | 96.3 | 325 | 95.0 | 712 | 97.1 | .082 |
| No pain during the disease | 40 | 3.7 | 17 | 5.0 | 21 | 2.9 | |
| Pain fulfilling generalised pain criteriaa(n = 869) | 224 | 25.8 | 71 | 25.4 | 148 | 25.3 | .937 |
| SD | SD | SD | |||||
| Intensity of pain (NVSb) in the last week (n = 1,071) | 5 | 2.66 | 5.0 | 2.54 | 4.6 | 2.70 | .036 |
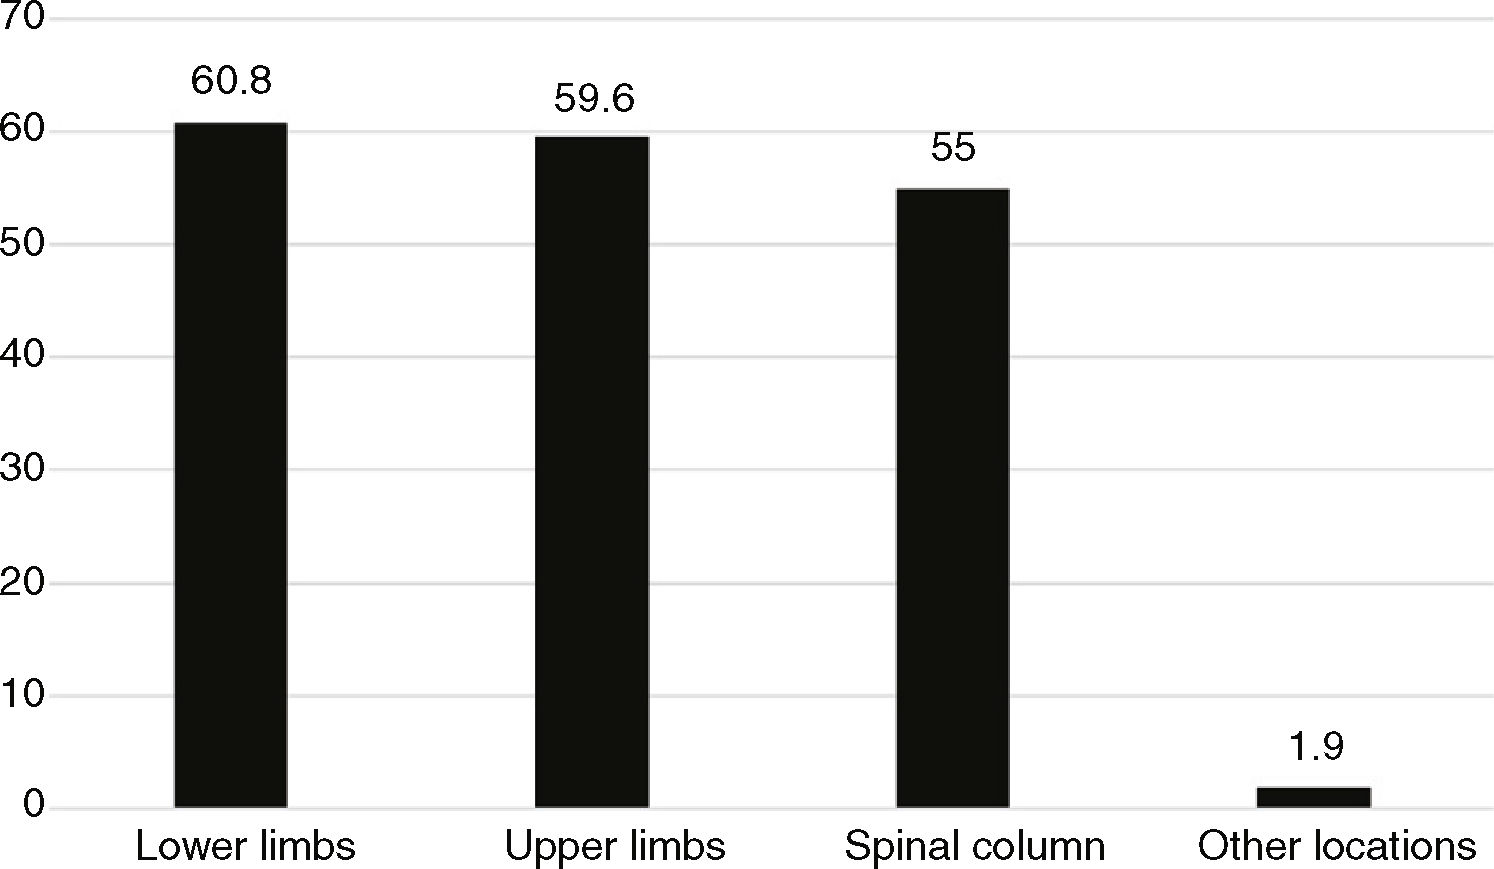
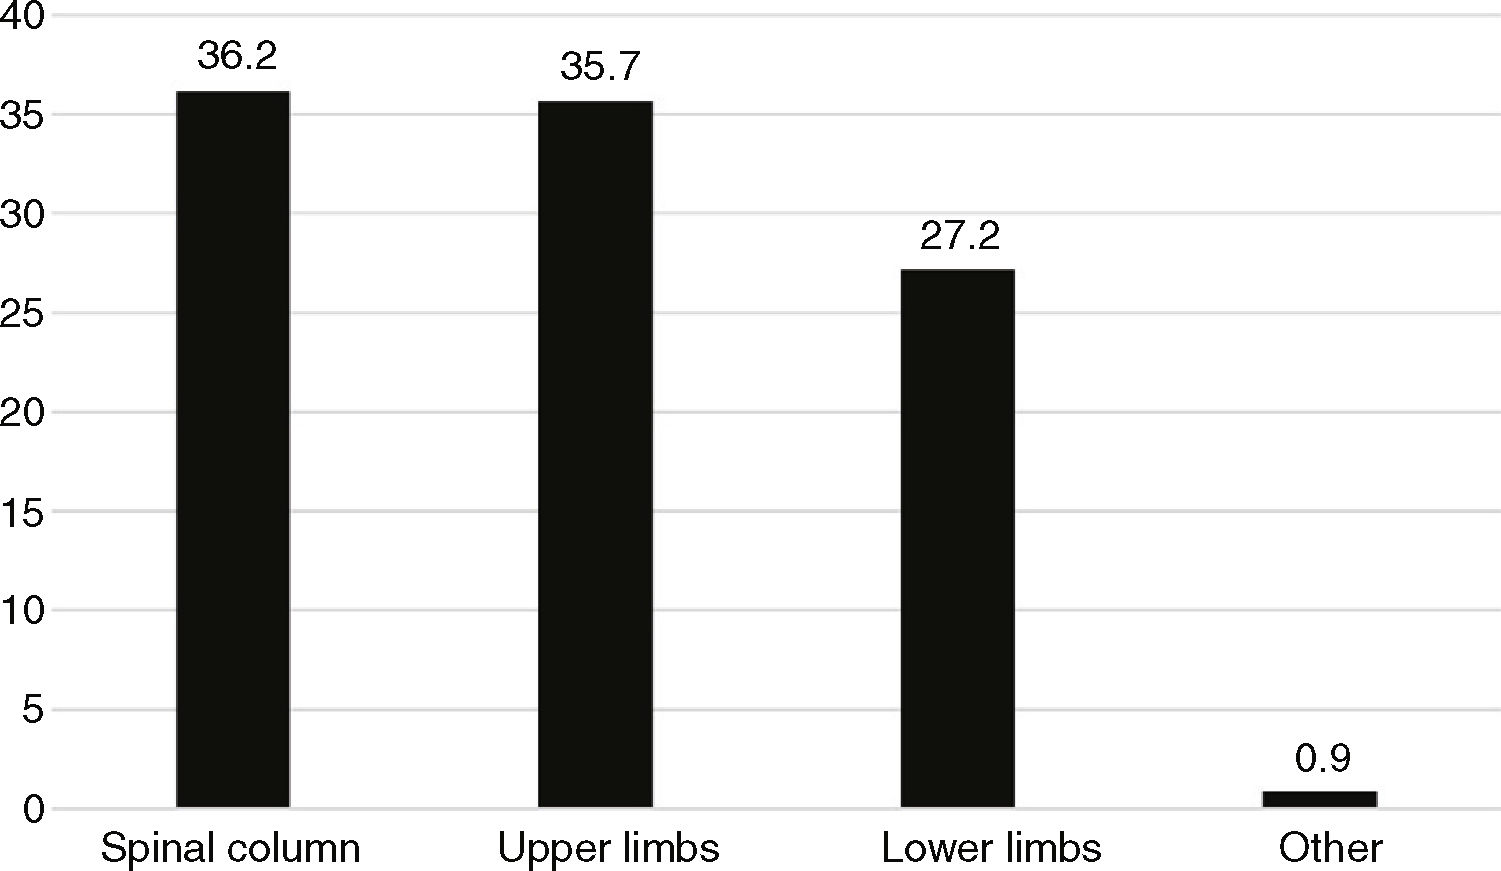
The locations of pain are shown in Fig. 3 (for all of the pains suffered by patients, regardless of their intensity) and Fig. 4 (for the dominant pain, defined as the one which the patient thought was the most intense or which h most affected their normal activity. Here it was only possible to identify one location).
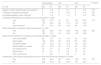
Nociceptive pain was the most common dominant pain (83.4% of all the patients in the sample)—somatic pain in 97.3%—, while neuropathic pain was far less common (12.0%) as was psychogenic pain (6.3%). The results for pain duration showed that the majority of the patients had suffered the pain for more than 3 months (80.5% of the total number of patients in the sample). Table 3 shows its form of presentation.
Dominant pain type.
| Total sample | PN | PR | P value* | ||||
|---|---|---|---|---|---|---|---|
| N | % | N | % | N | % | ||
| Type A (n = 1,034) | |||||||
| Continuous pain | 435 | 42.1 | 137 | 42.4 | 292 | 41.5 | .777 |
| Intermittent pain | 599 | 57.9 | 186 | 57.6 | 412 | 58.5 | |
| Type B (n = 1,034) | |||||||
| Predominantly resting | 185 | 17.9 | 41 | 12.7 | 144 | 20.5 | .005 |
| Predominantly moving | 551 | 53.3 | 191 | 59.0 | 356 | 50.6 | |
| Equally when resting or moving | 298 | 28.8 | 92 | 28.4 | 203 | 28.9 | |
| Type C (n = 1.030) | |||||||
| Daytime | 420 | 40.8 | 136 | 42.5 | 281 | 40.0 | .174 |
| Night | 146 | 14.2 | 36 | 11.3 | 110 | 15.6 | |
| All of the time | 464 | 45 | 148 | 46.3 | 312 | 44.4 | |
| Type D (n = 969) | |||||||
| With peaks or acute phases throughout the day | 640 | 66 | 201 | 66.8 | 437 | 66.1 | .840 |
| No peaks or acute phases throughout the day | 329 | 34 | 100 | 33.2 | 224 | 33.9 | |
The lumbar area (68%) was the most common location for dominant spinal pain, followed by the hands (56%) in the upper limbs and the knees (45%) in the lower limbs, with similar distribution in PN and PR.
Diagnoses of the dominant pain causes are shown in Fig. 5.
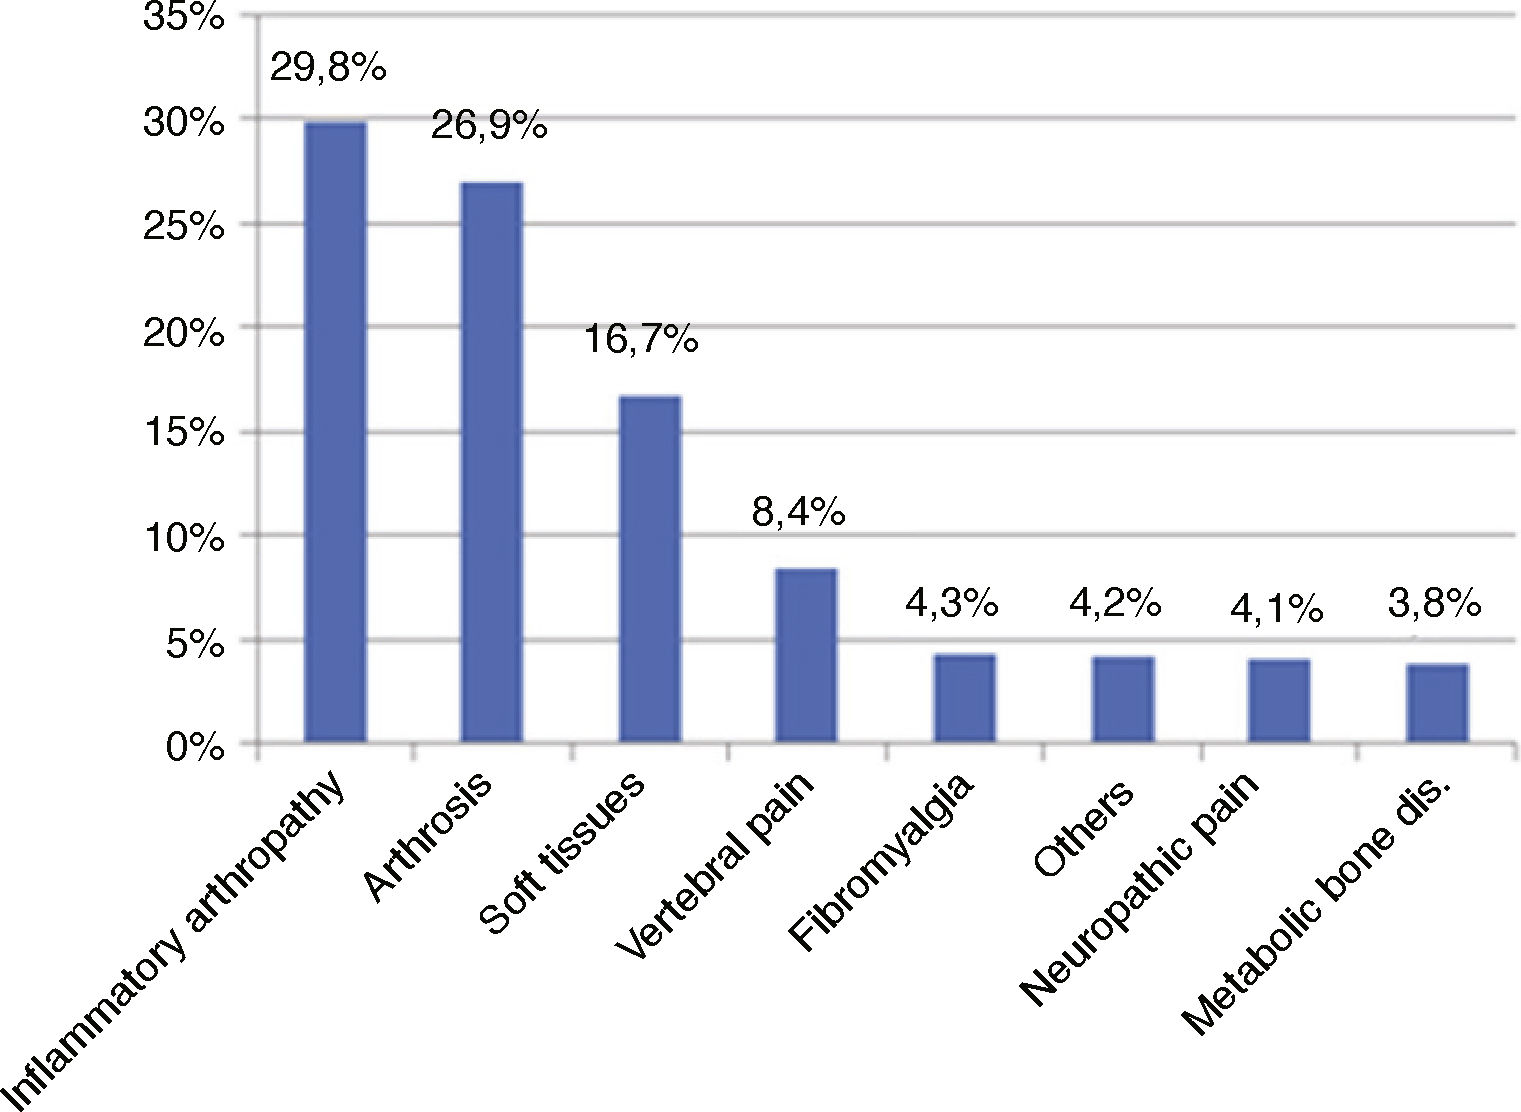
Significant differences were found between PN and PR. In the first of these the most usual diagnoses in order of frequency were arthrosis, soft tissue rheumatism, vertebral pain and inflammatory arthropathies (rheumatoid arthritis, ankylosing spondylitis and psoriatic arthritis were the most frequent, at 44%, 19% and 17% of the total, respectively). In the PR inflammatory arthropathies, arthrosis and soft tissue rheumatism were the most frequent.
If we compare both groups, the cases of arthrosis, soft tissue rheumatism, vertebral pain and neuropathic pain were more common in PN as causes of the dominant pain. Cases of inflammatory arthropathy, on the other hand, were more common in the PR.
Respecting comorbidity treatment, 42.5% of the total number of patients in the sample had taken an IBP gastric protector and 24.5% had taken an antihypertensive drug. There was significantly more frequent use of IBP treatment as well as steroids in the PR group compared to the PN.
85.6% of the total number of patients in the sample had been prescribed a specific pharmacological and/or interventionist treatment for pain (PN 74.8%; PR 90.5%). The frequency according to treatment type is shown in Fig. 6. Regarding pharmacological analgesic treatment, 46.3% of all the patients in the sample had received traditional NSAIDs in the previous month (97.5% of which were oral) and 42.5% had received simple analgesics. Traditional as well as COXIB NSAIDs were used significantly more often by the PR than was the case for the PN, and this was also true for major opioids (48.4%, 12.8% and 5.6%, as opposed to 41.2%, 6.1% and 1.5%, respectively). In the sample as a whole 23.5% had received opioid treatment in the previous month (minor or major).
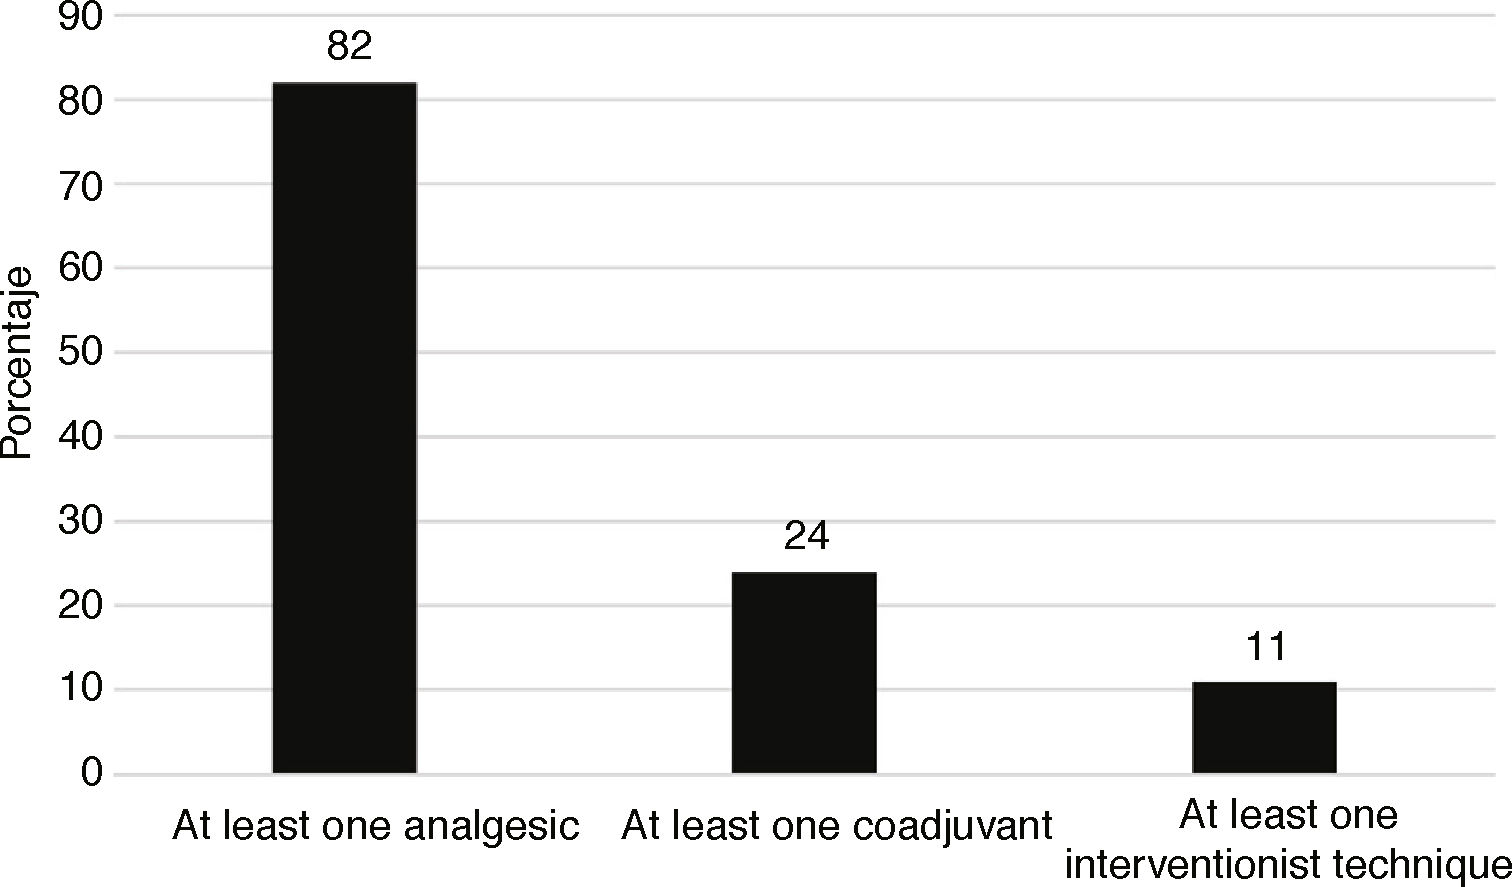
DMD and biological therapy stand out among the coadjuvants used (17%), together with corticoids (13%) and muscle relaxants (12%). Significant differences were detected between PN and PR respecting the use of DMD, biological therapy and corticoids. Corticoids are used far more frequently in PN (95% vs. 16%). On the contrary, DMD and biological therapy are clearly used more in patients visiting during follow-up (24% vs. 2%).
Infiltrations were the most common interventionist technique (9.1% of the total, 10.9% in the PR and 5.3% in PN).
26.3% of patients in the sample had received non-pharmacological therapy in the previous month (significantly more PR than PN; 29.9% and 18.7%, respectively). The use of techniques involving physical mobilisation stands out as more frequent, with physiotherapy (11.1%), rehabilitation (10.5%) and physical exercise and sports activities (10.4%). Rehabilitation was used more in the PR, as was physical exercise. The former was used more often for mechanical disease—12.4% of arthrosis and 19.4% soft tissue rheumatism—than it was for inflammatory arthropathies, at 8.7%; this may explain, at least partially, the predominance of inflammatory disease in the PR).
Table 4 shows the treatment prescribed in the basal visit.
Treatment prescribed in the basal visit.
| Total sample | PN | PR | P value* | ||||
|---|---|---|---|---|---|---|---|
| N = 1,084 | N | % | N | % | N | % | |
| Analgesics | 595 | 54.9 | 201 | 58.8 | 389 | 53.1 | .092 |
| Coadjuvants | 220 | 20.3 | 71 | 20.8 | 149 | 20.3 | .934 |
| Interventionist techniques | 103 | 9.5 | 41 | 12.0 | 62 | 8.5 | .085 |
| Non-pharmacological treatment | 93 | 8.6 | 30 | 8.8 | 62 | 8.5 | .957 |
| Other treatments | 192 | 17.7 | 61 | 17.8 | 130 | 17.7 | 1.000 |
Non-exclusive categories.
The data on the perception of controlled pain and satisfaction with treatment are shown in Table 5.
Perception that pain is controlled and satisfaction with treatment.
| Total sample | PN | PR | P value* | |||||
|---|---|---|---|---|---|---|---|---|
| N = 1,084 | Me | IR | Me | IR | Me | IR | ||
| Degree of relief obtained with pharmacological treatmenta | 6 | 4–8 | 5 | 2–7 | 6 | 4–8 | <.001 | |
| Tolerance of the treatment followedb | 8 | 6–10 | 8 | 5–9 | 8 | 6–10 | .003 | |
| Degree of pain intensity that the patient considers acceptablec | 2 | 0–4 | 2 | 0–4 | 2 | 1–4 | .812 | |
| Considers that treatment is sufficient to live a normal life (n = 988) | ||||||||
| Yes | 475 | 48.1 | 103 | 35.6 | 369 | 53.3 | <.001 | |
| No | 395 | 40 | 142 | 49.1 | 249 | 36.0 | ||
| Does not know | 118 | 11.9 | 44 | 15.2 | 74 | 10.7 | ||
| Pain controlled in comparison with previous pain, making it possible to undertake more activity and enjoy leisure activities (n = 1,038) | ||||||||
| Yes | 628 | 60.5 | 153 | 49.4 | 471 | 65.5 | <.001 | |
| No | 410 | 39.5 | 157 | 50.6 | 248 | 34.5 | ||
| State with treatment compared with previous state (n = 1,021) | ||||||||
| Very much better | 144 | 14.1 | 18 | 6.1 | 125 | 17.4 | < .001 | |
| Much better | 291 | 28.5 | 49 | 16.7 | 240 | 33.4 | ||
| Somewhat better | 305 | 29.9 | 111 | 37.9 | 191 | 26.6 | ||
| Neither better nor worse | 219 | 21.4 | 91 | 31.1 | 125 | 17.4 | ||
| Somewhat worse | 35 | 3.4 | 11 | 3.8 | 24 | 3.3 | ||
| Much worse | 23 | 2.3 | 11 | 3.8 | 12 | 1.7 | ||
| Very much worse | 4 | 0.4 | 2 | 0.7 | 2 | 0.3 | ||
| Current state is satisfactory taking into account all daily life activities, pain level and functional limitations (n = 1,044) | ||||||||
| Yes | 538 | 51.5 | 129 | 40.6 | 406 | 56.6 | <.001 | |
| No | 506 | 48.5 | 189 | 59.4 | 311 | 43.4 | ||
490 of the 515 patients who fulfilled the criteria visited again approximately 3 months after their first visit (with an average of 80 days between both visits and a standard deviation of 42). The average pain intensity during the previous week scored using the NVS was 4.5 (higher for PR than it was for PN; 4.7 vs. 4.1).
On the 11 point numerical scale (where 0 is “no pain” and 10 is “the worst imaginable pain”) in the short pain evaluation questionnaire, the median (Me) score for pain intensity was 6 for the maximum intensity in the previous 24 h, 3 for the minimum and 4 for average and current intensity. The difference between the PN and PR is significant for maximum intensity, as it is higher for the patients in follow-up (6 vs. 5), and also, although to a lesser degree, current pain intensity is also significantly higher. The degree to which pain is an interference, evaluated in the same questionnaire (on a scale where 0 means it “does not interfere” and 10 corresponds to “it interferes completely”) was higher for general activities, work and the ability to walk (Me = 4) than it was for mood, sleep and the capacity to enjoy life (Me = 3), and it was lowest in the capacity for social relations (Me = 2).
86.6% of the patients had adhered properly to the treatment they had been prescribed in their previous visit, according to the doctors. Their treatment had been modified for 35.9% of the patients since their basal visit (above all in terms of increasing dosage or frequency of administration), and this occurred more often in the PN than it did in the PR.
Table 6 shows data on perception that pain was controlled and degree of satisfaction with the treatment.
Perception that pain is controlled and satisfaction with treatment.
| Total sample | PN | PR | P value* | |||||
|---|---|---|---|---|---|---|---|---|
| N = 491 | Me | IR | Me | IR | Me | IR | ||
| Degree of relief obtained with the treatmenta | 6 | 4–8 | 6 | 4–7 | 6 | 4–8 | .512 | |
| Tolerance of treatment followedb | 8 | 5–9 | 8 | 5–9 | 8 | 6–9 | .527 | |
| Acceptable degree of pain intensityc | 2 | 1–4 | 2 | 1–3 | 2 | 2–4 | .037 | |
| Considers that treatment is sufficient to live a normal life (n = 466) | ||||||||
| Yes | 223 | 47.9 | 87 | 53 | 136 | 45.6 | .110 | |
| No | 179 | 36.5 | 52 | 31.7 | 124 | 41.6 | ||
| Does not know | 64 | 13.1 | 25 | 15.2 | 38 | 12.8 | ||
| Pain controlled in comparison with previous pain (n = 483) | ||||||||
| Yes | 294 | 60.9 | 107 | 62.9 | 186 | 60.2 | .555 | |
| No | 189 | 39.1 | 63 | 36.4 | 123 | 39.8 | ||
| State with the treatment in comparison with previous state (n = 484) | ||||||||
| Very much better | 52 | 10.7 | 19 | 11.2 | 33 | 10.6 | ||
| Much better | 149 | 30.8 | 52 | 30.8 | 95 | 30.5 | ||
| Somewhat better | 154 | 31.8 | 53 | 31.4 | 101 | 32.5 | ||
| Neither better nor worse | 98 | 20.2 | 36 | 21.3 | 60 | 19.3 | ||
| Somewhat worse | 18 | 3.7 | 6 | 3.5 | 12 | 3.9 | ||
| Much worse | 12 | 2.5 | 2 | 1.2 | 10 | 3.2 | ||
| Very much worse | 1 | 0.2 | 1 | 0.6 | 0 | 0.0 | ||
| Satisfactory current state (according to DLA, pain level and functional limitation) (n = 483) | ||||||||
| Yes | 234 | 48.4 | 86 | 50.6 | 148 | 47.9 | .573 | |
| No | 249 | 51.6 | 84 | 49.4 | 161 | 52.1 | ||
DLA: daily life activities.
The EVADOR study is the first one in Spain to cover pain epidemiology in rheumatology with a prospective component and national scope. A high prevalence of pain was found in unspecialised rheumatology surgeries (86% in the previous week and 96% at some time during the disease) in this study, in PN as well as PR. These data are very similar to those from the EPIDOR5 study for the second figure, although they are better for the first one (86% vs. 95%–100%), possibly because of better management of pain and its causes after 2004. The dominant pain is chronic in the majority of subjects in our study (81%), and this too is similar to the results of EPIDOR.5 A Dutch study showed a 44% prevalence of musculoskeletal pain, although this was in the general population of the Netherlands. The most frequent causes were up to 16% soft tissue rheumatism, 12% arthrosis, 3% arthritis and 1% fibromyalgia.23 Respecting pain intensity in the previous week, the average was moderate and slightly higher in new patients than it was in those being followed-up; this difference may be explained in part by rheumatological intervention in the latter and a higher prevalence of neuropathic pain in the former.24 The most frequent locations were the hands and lumbar spine, which may be partially due to the fact that both locations may be affected by inflammatory arthropathies as well as arthrosis, which are the most commonly diagnosed forms in association with the dominant pain. An important percentage of patients suffer continuous pain (even at night), predominating pain when resting and with peaks that may be defined as incidental, so it fulfils the criteria for pain with an important clinical repercussion.
Patients being followed-up are treated more often for pain, and they also use more NSAIDs, infiltrations and major opioids. This may be because of the intervention of a rheumatologist and because paracetamol is often the first option, due in part perhaps to the more frequent presence of cardiovascular comorbidity (especially arterial hypertension), so that NSAIDs are used less. On the other hand, the increased use of NSAIDs helps to explain the higher prevalence of digestive comorbidity in patients being followed-up. Non-pharmacological treatment is more frequent in the PR, probably because it is not usually used as the first line. There is a stronger perception among the PR that pain is under control and their treatment is satisfactory, probably aided by the therapy prescribed by the rheumatologist, particularly corticoids, DMD and biological treatments that, due to their anti-inflammatory efficacy, very probably help to mitigate pain (as inflammatory disease is more common in PR). 23.5% were in treatment with opioids in the month prior to their first visit, and this is higher than the EPIDOR5 figure (10%). This should be evaluated by taking into account that the maximum median intensity in the previous 24 h, in both visits, was 6 (and opioids are recommended when the intensity is higher than 5).
The average intensity of pain in the week prior to follow-up visits was moderate. This is surely due to the fact that fewer than half of the patients (48%) considered that they were in a satisfactory state and with sufficient treatment. In spite of this, the treatment prescribed in the first visit was only modified in 36% of cases, which may have been influenced by the fact that 61% considered that their pain was acceptably controlled in comparison with their previous pain. The said pain intensity during the previous week is less in new patients, perhaps because the mechanical problems that predominate in them respond better to therapy. The acceptable degree of pain intensity is higher in follow-up patients, probably due to the mainly chronic nature of the most common aetiology among them, inflammatory arthropathies.
Neuropathic pain appears in 12% of cases, and this percentage is higher than the one found in the general population (7%–8%).24 A possible explanation for this is that this type of pain often appears in rheumatic entities: arthrosis 30%;25 fibromyalgia 50%–75%;26 ankylosing spondylitis27 and rheumatoid arthritis.28 Respecting clinically relevant catastrophisation (PCS ≥ 30), it is similar in the basal visit to the figure obtained in samples of patients with chronic pain.22
Our study has the limitation that it excludes specialised surgeries, its vision being somewhat restricted to the outpatient rheumatology surgeries in our area. Diagnosis and treatment would be earlier in these units,29 so that the results of certain variables, such as pain management, may be different. Otherwise, apart from the said AUDIT29 study—which was undertaken in patients with rheumatoid arthritis followed-up in specialised RA or autoimmune disease surgeries in one region of our country, with the cited result—, we found no other literature on this subject. Another potential limitation is that, due to the time which elapsed between the performance of the study (in 2012) and now, certain results may have varied. For example, the medical use of opioids to control pain has not ceased increasing in developed countries30 so that it may have done so in the Spanish context of rheumatology too. In particular, and in our field, the prescription of major opioids by French rheumatologists reached 66% in 2016, especially for the management of acute painful processes (mainly acute radiculopathies and vertebral fractures).31 Nevertheless and to date, we have not heard of any new similar study at a national level that could renew the data supplied by ours.
To conclude, the prevalence of pain in the field of rheumatology remains high in our country, although this situation seems to have improved over the past decade. Neuropathic pain is relatively common in rheumatological processes, and it is recommendable not to lose sight of it, as it may require a different form of therapeutic management than the usual nociceptive pain. The use of opioids seems to have increased substantially in recent years. The data from this study offer an overview and make it possible to compare a range of rheumatic diseases with pain as their common fundamental element. Pain, functioning, quality of life and emotional state make it possible to perform a more homogeneous multidimensional analysis of rheumatic diseases. In this study it was possible to analyse the impact of pain, not as a symptom but rather as a complex neurosensorial process which in chronic cases is a problem in itself. Equally, for certain rheumatic diseases such as inflammatory ones, we have been able to define precise therapeutic strategies, so that we should also use this methodology for pain, to improve health results.
FinancingThe Fundación Española de Reumatología (FER) sponsored by Grünenthal Pharma S.A. This company did not take part in designing the project and nor did it intervene in the conclusions or text of the final report and this paper.
Conflict of interestsThe authors have no conflict of interests to declare in connection with this paper.
Javier Vidal Fuentes (Hospital Universitario de Guadalajara), Jesús Tornero Molina (Hospital Universitario de Guadalajara), Milena Gobbo (Unidad de Investigación. Sociedad Española de Reumatología).
Miguel Ángel Caracuel, Alejandro Escudero, Desiree Ruiz and Pilar Font (Hospital Universitario Reina Sofía); Ricardo Sánchez Perea (Hospital Clínico de Granada); Miguel Bernad (Hospital Universitario de La Paz); Antonio Fernández Nebro, María Ángeles Belmonte López, Virginia Coret Cagigal and Antonio Ponce (Hospital Carlos Haya); Rosa García Portales and Manuel de Haro Liger (Hospital Clínico Universitario de Málaga [Virgen de la Victoria]); José Luis Ballina, José Luis Riestra Noriega and Sara Alonso Castro (Hospital Universitario Central de Asturias); Sagrario Bustabad and M. Vanesa Hernández Hernández (Hospital Universitario de Canarias); Jaime Calvo (Hospital de Sierrallana); José Luis Cuadra (Hospital General de Ciudad Real); Javier Vidal (Hospital de Guadalajara); Juana Sampedro Álvarez, Isabel-Pastora Granados Bautista, Daniel Pielfort Garrido, Ángela García Aparicio, Rebeca Belmonte, Azucena Hernández Sanz and José Santos Rey Rey (Hospital Virgen de la Salud); Javier del Pino, Cristina Hidalgo Calleja, Susana Gómez Castro, Carlos Montilla Morales and María Dolores Sánchez González (Hospital Universitario de Salamanca); Cayetano Alegre and Juanjo de Agustín (Hospital Vall d’Hebron); Manuel Ciria Recasens and Miguel Ángel Campillo (Hospital del Mar); César Diaz Torne and Arturo Rodríguez (Hospital Sant Pau y Santa Creu); Antonio Renau Domingo and Javier García Miguel (Hospital Sagrado Corazón [Sagrat Cor]); Nuria Montala Palau and Montserrat Conde Seijas (Hospital Santa María de Lleida); Gaspar Pérez Lidon and Noelia Vázquez Fuentes (Hospital Universitario de Ceuta); Miguel Ángel Abad, María Torresano and María del Puerto (Hospital Virgen del Puerto); Víctor Quevedo Vila (Hospital Comarcal Monforte); Esther Rodríguez Almaraz, Rosa González Crespo and Beatriz Joven (Hospital Universitario 12 de Octubre); Marcelino Revenga and Javier Bachiller (Hospital Ramón y Cajal); Miguel Cantalejo Moreira, Raúl Veiga Cabello, Pilar Navarro Alonso and Alberto Diaz Oca (Hospital Universitario de Fuenlabrada); Gloria Candelas (Hospital Clínico San Carlos); Virginia Villaverde (Hospital de Móstoles); Alberto Bermúdez and María José Moreno (Hospital Virgen de la Arrixaca); Javier Duruelo Echevarrieta and Elena Garmendia Sánchez (Hospital de Cruces); José Antonio Gonzélez Ferrandez, Francisco Javier Navarro Blasco, José Raúl Noguera Pons and Juan Víctor Tovar Beltran (Hospital de Elche); Esteban Salas Heredia, Gregorio Santos Soler (Hospital Marina Baixa); Pilar Trenor and Noelia Abdilla (H.C.U de Valencia); Miguel Ángel Belmonte (Hospital Gral. de Castellón); Rafael Belenguer (Hospital 9 de Octubre); Juan Antonio Castellano Cuesta, Nagore Fernádez Llanio and Aida Ezzeddine Angulo (Hospital Arnau de Vilanova); Miguel Ángel Polo and Jordi Pons Dolset (Fundación Hospital de Calahorra).
Please cite this article as: Plana-Veret C, Seoane-Mato D, Goicoechea García C, Vidal-Fuentes J. y Grupo de Trabajo del Proyecto EVADOR Evaluación del dolor en consultas de reumatología españolas: Estudio EVADOR. Reumatol Clin. 2021;17:88–96.