

Knee pain resulting from osteoarthritis (OA) often leads to functional limitations and disabilities, significantly affecting an individual's quality of life. This study aimed to explore the factors associated with patient-reported outcome measures in knee OA.
MethodsA cross-sectional study was conducted using data from the Community Oriented Program for Control of Rheumatic Diseases (COPCORD) study in Jakarta. A home-to-home survey using multistage stratified random sampling was conducted involving subjects who met the clinical criteria for knee OA. Data collected included demographic information, body height and weight, history of injury, degree of work activities, presence of body aches and joint pain, and comorbidities. Patient-reported knee outcomes were assessed using the Knee Injury and Osteoarthritis Outcome Score (KOOS). Bivariate and multivariate analyses were performed to identify factors associated with KOOS and its subscales.
ResultsA total of 71 subjects meeting the clinical criteria for knee OA were included in the analysis, with a mean age of 54.54±9.97 years. Cardiovascular disease was significantly associated with overall KOOS scores and all five subscales. Additionally, OA subjects with a history of knee injury scored worse specifically on the KOOS quality of life subscale.
ConclusionCardiovascular disease and a history of knee injury were significantly associated with worse patient-reported knee outcomes among knee OA subjects. Future studies involving more cities are recommended to confirm these findings and provide more robust results for the Indonesian population.
El dolor de rodilla resultante de la osteoartritis (OA) a menudo conduce a limitaciones funcionales y discapacidades, afectando significativamente la calidad de vida de un individuo. Este estudio tuvo como objetivo explorar los factores asociados con las medidas de resultados informados por los pacientes en la OA de rodilla.
MétodosSe realizó un estudio transversal utilizando datos del estudio del Programa Orientado a la Comunidad para el Control de las Enfermedades Reumáticas (COPCORD) en Yakarta. Se llevó a cabo una encuesta de casa en casa utilizando un muestreo aleatorizado estratificado por etapas múltiples, involucrando sujetos que cumplían con los criterios clínicos para la OA de rodilla. Los datos recogidos incluyeron información demográfica, altura y peso corporal, historia de las lesiones, grado de actividades laborales, presencia de dolores corporales y articulares, y comorbilidades. Los resultados de rodilla informados por los pacientes se evaluaron utilizando el puntaje de lesiones de rodilla y osteoartritis (KOOS). Se realizaron los análisis bivariados y multivariados para identificar los factores asociados con el KOOS y sus subescalas.
ResultadosUn total de 71 sujetos que cumplían con los criterios clínicos para la OA de rodilla fueron incluidos en el análisis, con una edad media de 54,54±9,97 años. La enfermedad cardiovascular se asoció significativamente con los puntajes generales de KOOS y las 5 subescalas. Además, los sujetos con OA con un historial de lesiones de rodilla obtuvieron peores puntajes específicamente en la subescala de calidad de vida del KOOS.
ConclusiónLa enfermedad cardiovascular y un historial de lesiones de rodilla se asociaron significativamente con peores resultados de rodilla informados por los pacientes entre los sujetos con OA de rodilla. Se recomiendan futuros estudios que involucren más ciudades para confirmar estos hallazgos y proporcionar resultados más robustos para la población indonesia.
Musculoskeletal problems are among the most commonly reported complaints in the general population. The knee joint, being a significant weight-bearing joint exposed to considerable stress and use, commonly experiences pain and discomfort.1 Knee pain can affect individuals of all ages, and its prevalence varies widely, ranging from about 10% to 60%, depending on factors such as age, gender, ethnics, and geographical location.2–5 Osteoarthritis (OA), a degenerative joint disease, is one of the most common cause of knee pain and is associated with significant health and economic burden.6
Several factors have been identified as being associated with knee OA and its consequential impairment or disability. These factors include older age, female gender, higher body mass index (BMI), and history of knee injury.7–11 Additionally, higher level of physical activity is also reported as a contributor to knee problems.12 Other risk factors, such as the presence of comorbidities, lower education level, lower social class, and mental distress have also been associated with greater knee problems and disability.12–14 However, community-based studies thoroughly investigating these factors are still lacking.
Knee pain does not just cause physical discomfort; it frequently results in substantial functional limitations and disabilities that profoundly affect one's quality of life. Moreover, recent studies have demonstrated that knee pain is a better predictor of disability and functional status than radiographic severity.15,16 To evaluate patient's perception on symptoms and functioning, patient-reported outcome measures are often employed. The Knee Injury and Osteoarthritis Outcome Score (KOOS) is a knee-specific instrument which has been widely used to assess the patients’ opinions on their knee problems. It evaluates both short-term and long-term symptoms as well as the overall function of the knee in cases of injury and osteoarthritis.17
The World Health Organization and the International League Against Rheumatism (WHO-ILAR) have initiated the Community Oriented Program for Control of Rheumatic Diseases (COPCORD) as a means of screening for rheumatologic symptoms in the population across countries. Utilizing the COPCORD data gathered in Jakarta, Indonesia, this study aims to investigate the factors associated with patient-reported outcome measures – including symptom severity, activity and functional limitations, and quality of life – in the population experiencing knee OA within an urban community setting. Understanding these factors is crucial for identifying populations with knee OA who are at risk of experiencing worse outcomes. This knowledge allows for timely implementation of preventive measures and interventions to halt the progression of disability.
MethodsStudy design and data collectionThis cross-sectional study was part of the COPCORD study conducted in Jakarta, Indonesia. A home-to-home survey was conducted in five administrative cities of Jakarta. Sampling was carried out using the multistage stratified random sampling method. A district was selected from each administrative city as a region of interest, followed by the random selection of two subdistricts from each district. Subsequently, several neighborhoods were randomly selected from each subdistrict until the desired number of participants from each city was reached. Subjects aged ≥18 years who agreed to participate in the study were interviewed by trained physicians, using a questionnaire from WHO-ILAR COPCORD which has been translated to Indonesian and validated. After completing the questionnaires, participants reporting knee symptoms were further evaluated by a rheumatologist for the presence of knee OA according to American College of Rheumatology (ACR) clinical classification criteria for knee OA. Subjects fulfilling the criteria were included in the analysis.
Demographic data, body height and weight, history of knee injury, degree of work activities, presence of body aches and joint pain, and comorbidities were collected. BMI was calculated from the reported height and weight. According to the WHO Asian-Pacific BMI classification, a BMI of 18.5–22.9kg/m2 was considered normal, 23.0–24.9kg/m2 was classified as overweight, and a BMI of ≥25.0kg/m2 was classified as obese.18 Degree of physical work activities was classified into low, moderate, and high, according to the subject's perception. Subjects were also interviewed using the Indonesian KOOS questionnaire was used to assess patient-reported symptom severity in patients who have clinical knee OA according to the ACR criteria. It consists of five subscales: pain (9 items), symptoms (7 items), function in daily living (17 items), function in sports and recreation (5 items), and quality of life (4 items). A Likert scale is employed for each item, and the score of each subscale is calculated as the sum of its included items. The score is then transformed onto a 0 to 100 scale, with zero representing “extreme problems” and 100 representing “no problems”.17
This study has been approved by the Ethical Committee Board of Faculty of Medicine, Universitas Indonesia, with approval number KET-425/UN2.F1/ETIK/PPM.00.02/2023 and was performed according to the principles of the Declaration of Helsinki. We have also obtained research permission from the local Jakarta government (number 40/AF.1a/31/1/TM.23.04/e/2023). Written consents were obtained from all subjects before participation in the study.
Statistical analysisUnivariate analyses were performed to present the characteristics of the subjects. Categorical variables were presented as proportions, while numerical variables were presented as means and standard deviations (SDs) if the data were normally distributed, or as median and range if otherwise. In the bivariate analyses, KOOS was used as the outcome variable, while the remaining variables were considered as predictor variables. Comparison between groups of categorical variables were analyzed using independent t-test or Mann–Whitney test for categorical variables with two groups, or one-way ANOVA or Kruskal–Wallis test for categorical variables with more than two groups, according to whether data were normally distributed. Pearson correlation analysis was conducted to assess the association between numeric variables and the outcome.
Multivariate multiple regression analysis was conducted for predictor variables with a p-value of <0.25 in the bivariate analysis. Statistical significance was set at a p-value of <0.05. All statistical analyses were performed using Statistical Package for the Social Sciences (SPSS) v.24.0.
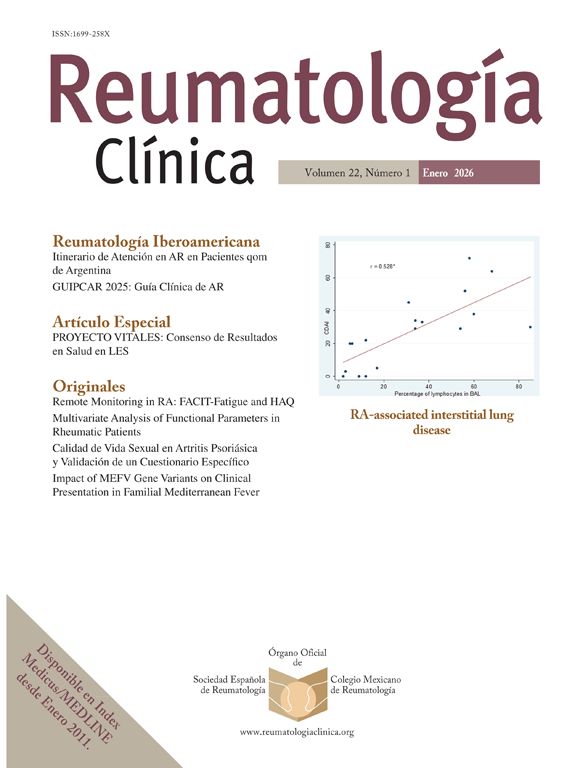
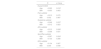
ResultsDemographic and clinical profile of participantsIn this study, we aimed to assess knee health and functionality among knee OA individuals in the main COPCORD study using the KOOS questionnaire. Initially, 534 subjects participated in the survey, and 93 subjects reporting knee symptoms were further evaluated for OA (Fig. 1). A total of 71 subjects fulfilling the clinical knee OA criteria were included in the analysis. The demographic and clinical characteristics of the participants offer fundamental insights into our study population. The majority of our subjects were female, with a mean BMI falling into the overweight category. The prevalence of comorbidities such as body pain (67.6%) and joint pain (93.0%) was notable, as seen in Table 1.

Characteristics of participants.
| Variable | Frequency (n=71) | Percentage (%) |
|---|---|---|
| Age (years) | Mean (SD): 54.54±9.97Median (range): 55.00 (23–78) | |
| Sex | ||
| Male | 15 | 21.1 |
| Female | 56 | 78.9 |
| BMI (kg/m2) | Mean (SD): 23.87±5.11Median (range): 23.40 (15.9–37.4) | |
| History of injury | ||
| No | 42 | 59.2 |
| Yes | 29 | 40.8 |
| Degree of physical work | ||
| Low | 18 | 25.4 |
| Moderate | 33 | 46.5 |
| High | 20 | 28.2 |
| Comorbidities | ||
| Body pain | ||
| No | 23 | 32.4 |
| Yes | 48 | 67.6 |
| Joint pain | ||
| No | 5 | 7.0 |
| Yes | 66 | 93.0 |
| Hypertension | ||
| No | 45 | 63.4 |
| Yes | 26 | 36.6 |
| Diabetes melitus | ||
| No | 64 | 90.1 |
| Yes | 7 | 9.9 |
| Cardiovascular disease | ||
| No | 66 | 93.0 |
| Yes | 5 | 7.0 |
| Autoimmune | ||
| No | 71 | 100.0 |
| Yes | 0 | 0.0 |
| Stroke | ||
| No | 71 | 100.0 |
| Yes | 0 | 0.0 |
| Gout | ||
| No | 54 | 76.1 |
| Yes | 17 | 23.9 |
BMI, body mass index; SD, standard deviation.
The examination of KOOS in our study population provides a comprehensive understanding of knee health and functionality, including both overall scores and detailed subscale analyses. The mean overall KOOS of the participants was 72.31, indicating a moderate level of knee health among participants (Table 2).
KOOS values of participants (n=71).
| KOOS | Mean±SD or median (min–max)a |
|---|---|
| Overall KOOS | 72.31±15.46 |
| Pain subtotal | 83.33 (25–100) |
| Symptoms subtotal | 77.01±15.80 |
| ADL subtotal | 88.24 (38–100) |
| Sport/Rec subtotal | 62.75±27.20 |
| QoL subtotal | 57.48±18.77 |
ADL, activities in daily living; QoL, quality of life; Sport/Rec, function in sports and recreation.
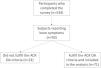
Statistical analyses, including Mann–Whitney, independent t-tests, ANOVA, and Kruskal–Wallis tests, were conducted to investigate the relationship between categorical independent variables and KOOS and its subscales. Significant differences were observed in overall KOOS and all KOOS subscales among participants with a history of cardiovascular disease compared to those without (Table 3).
Association between independent variables and KOOS.
| Variables | Overall KOOS | Pain subtotal | Symptoms subtotal | ADL subtotal | Sport/Rec subtotal | QOL subtotal |
|---|---|---|---|---|---|---|
| (mean±SD) | (median (range))a | (mean±SD) | (median (range))a | (mean±SD) | (mean±SD) | |
| Sex | ||||||
| Male | 74.83±13.40 | 86.11 (53–100) | 79.76±11.19 | 94.12 (56–100) | 64.67±27.48 | 60.42±18.25 |
| Female | 71.74±16.02 | 83.33 (25–100) | 76.28±16.83 | 87.50 (38–100) | 62.23±27.35 | 56.70±18.99 |
| p-Value | 0.482c | 0.707b | 0.452c | 0.293b | 0.761c | 0.499c |
| History of injury | ||||||
| Yes | 72.66±15.33 | 83.33 (47–100) | 77.46±13.97 | 88.24 (43–100) | 67.07±24.80 | 52.37±20.35 |
| No | 72.07±15.74 | 83.33 (25–100) | 76.70±17.11 | 87.50 (38–100) | 59.76±28.65 | 61.01±16.95 |
| p-Value | 0.876c | 0.626b | 0.843c | 0.598b | 0.269c | 0.056c |
| Degree of physical work | ||||||
| Low | 69.91±20.08 | 88.89 (25–94) | 73.21±18.87 | 91.91 (38–100) | 61.39±33.07 | 50.69±22.37 |
| Moderate | 72.95±12.86 | 83.33 (42–100) | 78.03±14.21 | 86.76 (50–100) | 61.52±24.09 | 60.23±17.67 |
| High | 73.43±15.32 | 81.94 (44–97) | 78.75±15.57 | 88.97 (46–100) | 66.00±27.46 | 59.06±16.28 |
| p-Value | 0.749d | 0.596e | 0.498d | 0.631e | 0.824d | 0.204d |
| Body pain | ||||||
| Yes | 71.34±14.26 | 83.33 (42–100) | 77.08±13.74 | 86.76 (43–100) | 59.79±25.01 | 56.64±17.88 |
| No | 74.34±17.89 | 83.33 (25–100) | 76.86±19.76 | 91.18 (38–100) | 68.91±30.97 | 59.24±20.80 |
| p-Value | 0.448c | 0.626b | 0.957c | 0.366b | 0.188c | 0.589c |
| Joint pain | ||||||
| Yes | 72.11±15.98 | 83.33 (25–100) | 77.16±16.30 | 86.76 (38–100) | 62.35±27.82 | 57.77±19.31 |
| No | 74.98±4.89 | 88.89 (81–92) | 75.00±6.68 | 89.71 (88–96) | 68.00±18.24 | 53.75±9.48 |
| p-Value | 0.692c | 0.343b | 0.770c | 0.339b | 0.657c | 0.648c |
| Hypertension | ||||||
| Yes | 68.74±17.59 | 80.56 (25–100) | 74.18±17.88 | 87.50 (38–100) | 57.31±29.64 | 53.61±17.87 |
| No | 74.38±13.88 | 86.11 (47–100) | 78.65±14.42 | 88.24 (43–100) | 65.89±25.50 | 59.72±19.10 |
| p-Value | 0.140c | 0.219b | 0.253c | 0.788b | 0.203c | 0.188c |
| Diabetes mellitus | ||||||
| Yes | 64.03±17.75 | 75.00 (42–92) | 73.98±15.11 | 77.94 (50–97) | 47.14±29.28 | 50.00±13.01 |
| No | 73.22±15.07 | 83.33 (25–100) | 77.34±15.95 | 88.24 (38–100) | 64.45±26.65 | 58.30±19.19 |
| p-Value | 0.137c | 0.421b | 0.596c | 0.288b | 0.110c | 0.270c |
| Cardiovascular disease | ||||||
| Yes | 50.61±19.00 | 69.44 (25–81) | 54.29±21.78 | 72.06 (38–85) | 30.00±17.68 | 40.00±25.23 |
| No | 73.96±14.01 | 84.72 (42–100) | 78.73±14.03 | 88.97 (43–100) | 65.23±26.25 | 58.81±17.75 |
| p-Value | 0.001*,c | 0.006*,b | 0.001*,c | 0.017*,b | 0.004*,c | 0.030*,c |
| Gout | ||||||
| Yes | 69.74±18.90 | 80.56 (25–97) | 75.00±19.44 | 85.29 (38–100) | 61.75±31.47 | 54.41±16.79 |
| No | 73.12±14.33 | 84.72 (42–100) | 77.65±14.62 | 88.97 (43–100) | 63.06±26.03 | 58.45±19.39 |
| p-Value | 0.436c | 0.556b | 0.551c | 0.613b | 0.866c | 0.443c |
Variables with p-value <0.25 were included in the multivariate analysis.
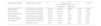
Correlation analyses (Table 4) revealed associations between age dan BMI with overall KOOS and its subscales. A negative correlation was observed between age and KOOS and its subscales, indicating that older participants tended to report lower scores in overall KOOS, Symptoms, ADL, and Sport/Rec subscales. However, BMI did not exhibit a significant correlation with overall KOOS or its subscales.
Correlation analyses between continuous independent variables and KOOS scores.
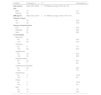
Variables with p-value <0.25 in bivariate analysis were included in the multivariate analysis. Multiple regression analysis (Table 5) revealed the multivariate relationships between KOOS and its subscales and various independent variables. A history of cardiovascular disease was significantly associated with worse KOOS across all subscales (Pain, Symptoms, ADL, Sport/Rec, and QoL subtotal). Additionally, a history of knee injury was significantly associated with worse score specifically in the QoL subscale.
Multiple regression analysis of the variables.
| Dependent variable | Independent variable | B | 95% CI for B | β | p-Value | |
|---|---|---|---|---|---|---|
| Lower limit | Upper limit | |||||
| Overall KOOS | Cardiovascular disease | −26.32 | −40.12 | −12.52 | −0.37 | <0.001 |
| Pain subtotal | Cardiovascular disease | −22.32 | −34.73 | −9.9 | −0.35 | 0.001 |
| Symptoms subtotal | Cardiovascular disease | −27.49 | −41.48 | −13.5 | −0.38 | <0.001 |
| ADL subtotal | Cardiovascular disease | −19.62 | −32.08 | −7.16 | −0.31 | 0.002 |
| Sport/Rec subtotal | Cardiovascular disease | −39.94 | −63.56 | −16.32 | −0.33 | 0.001 |
| QoL subtotal | Cardiovascular disease | −22.10 | −39.43 | −4.77 | −0.25 | 0.013 |
| History of injury | −8.57 | −16.60 | −0.54 | −0.21 | 0.037 | |
In this study, we investigated the factors associated with patient-reported outcome measures, as assessed by the KOOS questionnaire, in patients experiencing knee OA. Our main results demonstrated that CVD was significantly associated with increased pain and symptoms, greater limitations in daily activities and sports/recreation participation, and a lower quality of life. Furthermore, OA subjects with history of knee injury scored worse specifically in the QoL subscale.
CVD was independently associated with worse KOOS across all subscales in our study, indicating more severe functional impairment and symptoms of knee OA among subjects with CVD. This finding aligns with previous studies demonstrating the close relationship between CVD and OA. Patients with knee OA have been reported to have an increased risk of CVD. A meta-analysis by Wang et al. showed a 24% higher risk of CVD among OA subjects compared to the general population.19 Physical inactivity and the shared risk factors between the two diseases have been postulated to explain the increased risk of CVD among OA patients.19,20 Conversely, we cannot rule out that CVD may also play a role in exacerbating the severity of knee OA symptoms, highlighting the interrelationship between the two conditions. For instance, Goel et al. found that an increasing cardiovascular risk score was positively correlated with greater OA severity.21 There is growing evidence that systemic inflammation and vascular pathology are implicated in the association between CVD and OA. A systematic review by Hussain et al. suggested a link between vascular pathology and knee OA, finding that baseline vascular pathology was associated with the progression of knee OA over subsequent years.22 Additionally, patients with OA were found to have increased arterial stiffness compared to controls.23 These findings suggest that vascular pathology may play a significant role in the development and progression of OA.22 Vascular alterations may hinder blood supply to the subchondral bone region, resulting in ischemia and hypoxia of the bone. This hypothesis aligns with the findings of Chang et al., which demonstrated the presence of hypoxia in the osteoblasts and chondrocytes of OA joints.24
A history of knee injury was significantly associated with the QoL subscale of KOOS. The QoL subscale broadly captures several aspects of knee problems, including self-awareness of knee issues, lifestyle modifications due to knee problems, the feeling of being troubled by knee problems, and the overall consequences.25 Previous studies have shown that the QoL subscale is highly responsive and scores worse in patients undergoing anterior cruciate ligament reconstruction with ongoing symptoms compared to other KOOS subscales, suggesting its high sensitivity in capturing an individual's reported knee problems, especially following an injury.26
Cartilage injury may result in “wear and tear” damage and subsequent OA development. Furthermore, muscle dysfunction associated with injury may result in greater force being transmitted to the bones and joints as impact forces are not being absorbed properly.27 A study assessing knee symptoms among downhill runners found that a self-reported history of knee injuries was associated with worse KOOS scores on all subscales, while our study found a significant association only on the KOOS QoL subscale.9 However, in this study, we did not further explore the details of knee injury, such as the type, severity, and mechanism of injury. It is possible that knee injuries suffered by athletes were more severe, thus affecting the KOOS scores to a greater extent. Exploring the nature of the injury and its effects on symptom severity might help clinicians identify individuals who are at higher risk for OA progression and severity.
Age was found to be significantly negatively correlated with the overall KOOS, Symptoms, ADL, and Sport/Rec subscales; however, this association was not significant upon multivariate analysis. This finding aligns with a previous study by Oishi et al. in a Japanese population, which showed that overall KOOS scores and all its subscales decreased with age, with an approximately 20-point decrease per decade.28 Although age is known to be one of the main risk factors for OA development, the current multifactorial concept of OA emphasizes that aging alone does not directly cause OA. Other OA risk factors, in addition to musculoskeletal aging, contribute to OA development.29 This highlights the importance of controlling other known OA risk factors, especially in the elderly population, to prevent further OA development and progression.
BMI was not found to be correlated with symptom severity in our OA subjects, in contrast to findings from previous studies. Higher BMI has been identified as a risk factor for knee OA.30 Studies on the influence of BMI on KOOS scores have demonstrated variable results. For example, a study by Larsen et al. in Denmark involving obese and superobese patients who were planning bariatric surgery demonstrated significantly worse KOOS subscales compared to values from the general population.31 However, this study included patients with a BMI of 35kg/m2 and higher, with a mean BMI of 48.3, which is significantly higher than that of our subject population (mean BMI 23.87). Marot et al. studied KOOS score variations in a healthy population and found that individuals with a BMI over 25kg/m2 scored worse specifically on the ADL subscale, yet no clinically significant differences (defined as a difference of more than 8 points) were observed across all subscales.32
Although knee OA subjects often present with overweight or obesity, it is interesting to note that the mean BMI in our knee OA population is relatively lower compared to other studies, especially those conducted in Western populations, which tend to have a higher obesity prevalence. For instance, a study by Fosdahl et al. in Norway involving 4265 individuals with knee or hip OA had a mean BMI of 28.1±4.9kg/m2.33 Values tend to be lower in Asian populations; for example, Park et al. reported a mean BMI of 24.2±2.9kg/m2 among OA subjects in a Korean population.34 Traditionally, obesity has been associated with increased mechanical load on the joints. However, recent studies have indicated that obesity-induced adipokine production also contributes to the inflammatory component in OA development and progression.35 This is supported by evidence showing that central obesity is associated with OA, even without general obesity (as indicated by BMI), confirming the role of adipose tissue in OA inflammation. Therefore, exploring other obesity-related parameters aside from BMI, such as waist circumference, may further explain the link between obesity and OA, especially in Asian populations, which are more likely to be centrally obese than their Caucasian counterparts with the same BMI.34,36
There are several limitations to this study. First, we cannot establish causality between the factors and patient-reported knee outcomes due to the cross-sectional design. Second, the OA diagnosis was made solely based on clinical criteria without radiological evidence. Combining clinical and radiological criteria would provide a more accurate diagnosis. Furthermore, the information obtained from subjects was self-reported, including comorbidities and history of injury, without confirmation from medical records, which may introduce recall bias. Finally, our community-based study was conducted in only one city with a relatively small number of OA subjects. Including a greater number of cities, representing both urban and rural areas, would make the findings more representative of the Indonesian population and yield more generalizable results.
ConclusionIn conclusion, cardiovascular disease and a history of knee injury were significantly associated with worse patient-reported knee outcomes among knee OA subjects as assessed by KOOS. Future studies involving more cities are recommended to confirm these findings and provide more robust results for the Indonesian population.
FundingThis research is funded by Directorate of Research and Development, Universitas Indonesia under Hibah PUTI 2023 (grant no. NKB-148/UN2.RST/HKP.05.00/2023).
Authors’ contributionsR.H. and F.P. conceived and designed the study. F.P. coordinated the sampling process. S., S.A.K.W., A.A., J.D., and A.P.A. contributed to data acquisition and analysis. R.H., F.P., J.A., and M.A. performed data interpretation. All authors contributed equally to drafting the manuscript and reviewing the manuscript substantively. All authors have read and approved of the final manuscript.
Conflict of interestsThe authors declared no conflict of interests.
The authors would like to thank the subjects who have participated in this study.